






USDCAD tests key resistance territory after pullback from ytd highs

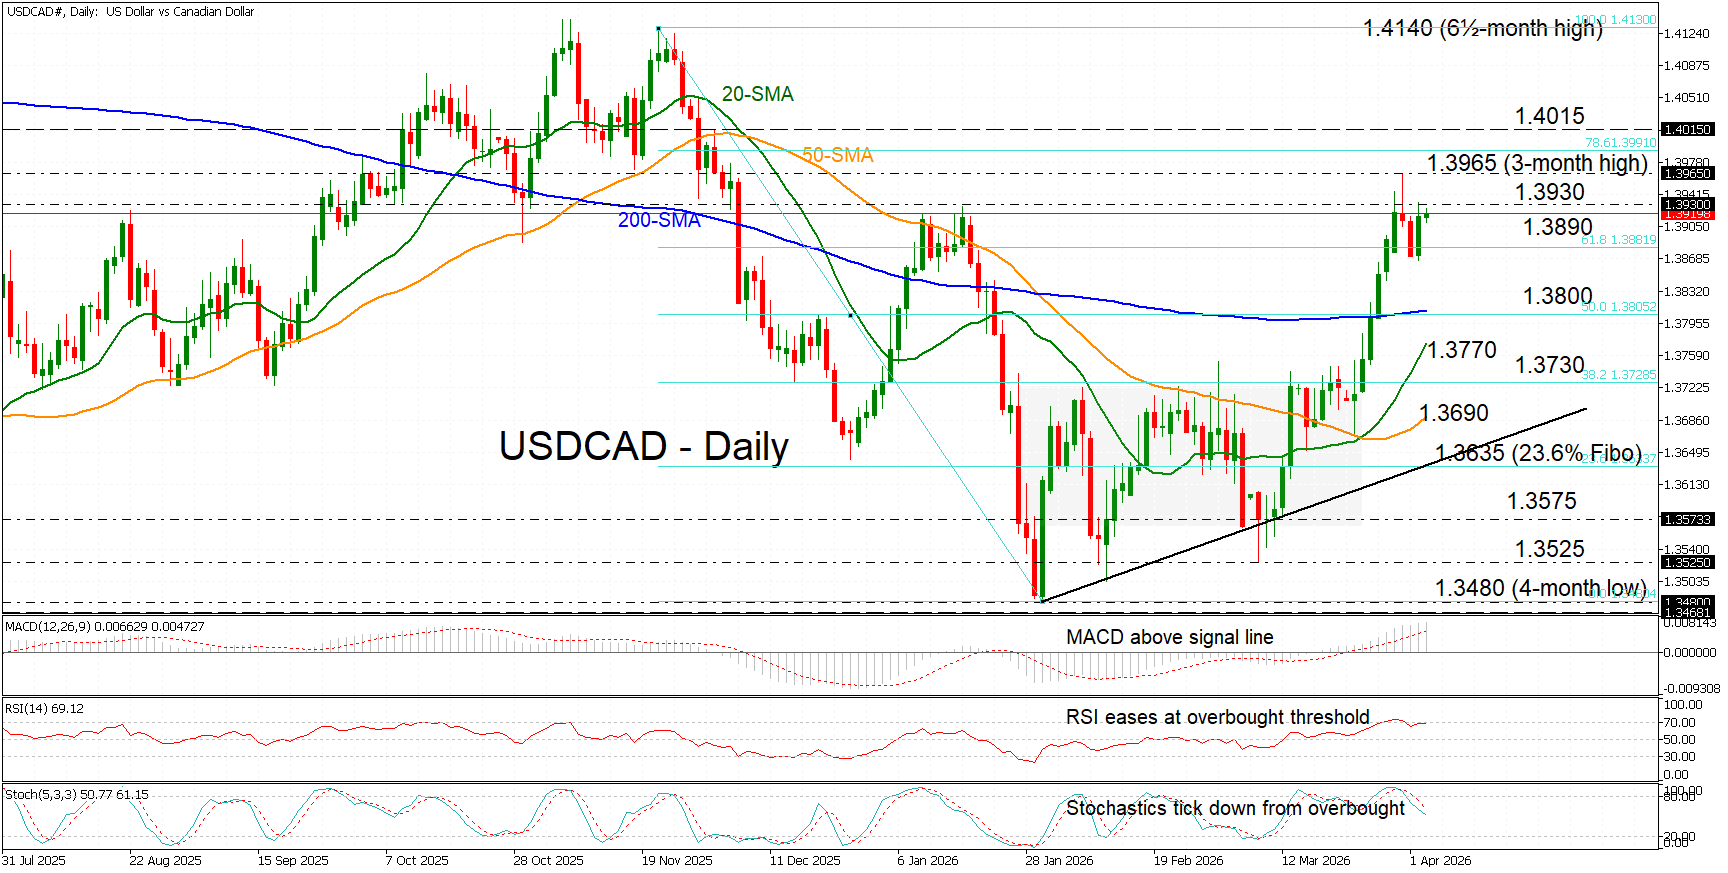
USDCAD has been oscillating within the 1.3890-1.3930 resistance territory since the beginning of the week, repeatedly testing the upper boundary after a brief break to the three‑month and year-to-date high of 1.3965 on Tuesday.
If the pair manages to break decisively above this strong resistance zone – and further above the ytd peak, which also coincides with a major December support region – it would signal a continuation of the broader uptrend that has been forming higher lows since the January 30 bottom. The next resistance hurdle sits at the December 2 swing high near 1.4015, before the pair potentially heads toward the multi‑year peak near 1.4140.
That said, the momentum indicators show the upside stalling. The MACD remains in positive territory, but the RSI has failed to firmly enter overbought territory. Further, the stochastics are also ticking lower from overbought levels, pointing to fading momentum.
A decisive dip below the 61.8% Fibonacci retracement of the November-January pullback at 1.3890 could be followed by a break under the 200‑day simple moving average (SMA) near the 1.3800 psychological level, shifting the outlook to bearish. This would be reinforced by subsequent breaches of the upward‑sloping 20‑ and 50‑day SMAs at 1.3770 and 1.3690, respectively.
Summing up, USDCAD is attempting to clear a key resistance zone, and a confirmed break above it would signal a resumption of the broader upside trend. However, another rejection from this region would likely keep the pair in consolidation, as long as price action remains supported by the 61.8% Fibonacci level.


Oil Surge Pressures US Stocks as Markets Await Inflation Data

Currency Divergence Deepens as Yen Strength Challenges Global Markets | 4th September, 2026

USDCAD slides: Is a freefall to 1.3700 next?

USD/CAD Outlook: Trade Dispute, BoC and NFP Could Put Pressure on the Loonie

Gold and Oil Rise as Central Bank Signals Drive Currency Markets | 3rd September, 2026

Global Markets Reprice Risk as Oil, Yields and Central Banks Collide | 2nd September, 2026

Canadian Dollar Shrugs Off Tariff Shock as Markets Focus on Bigger Risks