






USDJPY bears face their most crucial test so far

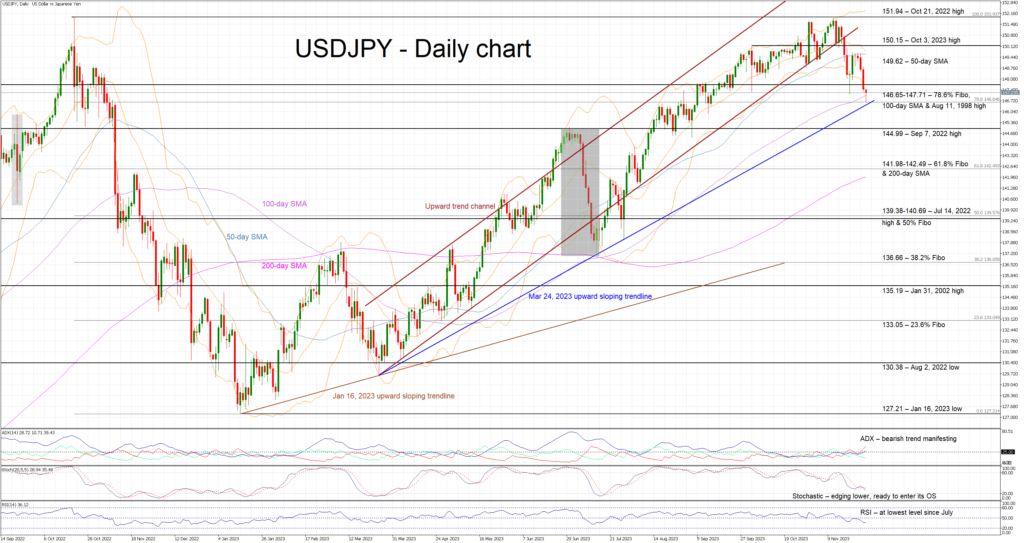
USDJPY is again lower today, recording its fifth consecutive red candle for the first time since the July correction. It is now testing the support set by the 100-day simple moving average (SMA) and the March 24, 2023 upward sloping trendline. Especially, in the case of the latter, USDJPY failed to trade below this trendline during July, thus raising the importance of this battle.
In the meantime, the momentum indicators are endorsing the current move. The Average Directional Movement Index (ADX) has managed to climb above its 25-threshold, thus signaling a bearish market trend. More importantly, the RSI has dropped below its 50-midpoint, reaching its lowest level since July and revealing strong bearish pressure. Crucially, the stochastic oscillator has edged below its moving average, restating its bearish tendency, and moving towards its oversold area.
Should the bears feel invigorated, they could try to break the strong support set by the 146.65-147.71 area that is populated by the 100-day SMA, the August 11, 1998 high, the 78.6% Fibonacci retracement of the October 21, 2022 - January 16, 2023 downtrend and the March 24, 2023 trendline. If successful, they could then have the chance for an even more protracted sell-off towards the next key area at 141.98-142.49 area, provided they overcome the September 7, 2022 high at 144.99.
On the flip side, the bulls appear ready to protect their gains and to defend the 146.65-147.71 area. They could then gradually push USDJPY towards the 50-day SMA at 149.62 and then test the resistance set by the October 3, 2023 high at 150.15. Even higher, their main target appears to be the October 21, 2022 high at 151.94.
To sum up, USDJPY bears have retaken control of the market but for the current move to have legs, they need to break the busy 146.65-147.71 area and the ascending trendline residing there.


The yen is strengthening before our very eyes

US Yields Rise Despite Buybacks; Eyes on ECB Hike

Today Fundamental Analysis: Brent Holds Around $100 Amid Fresh US-Iran Escalations

Today Technical Analysis: Japanese Yen Hits Highest Level Against the Dollar Since February

Yen Hits 6-Month High, Volatility Returns After North American Holiday.

USD/JPY Falls Below 154.000 as BOJ Rate Hike Bets Support Yen

USDJPY hits 7-month lows: recovery or bear trap?