





EUR/CHF Short EUR Risk vs CHFCarry Unwind Macro Fx Analyse


My thesis: a weaker euro & suddenly stronger Swiss franc.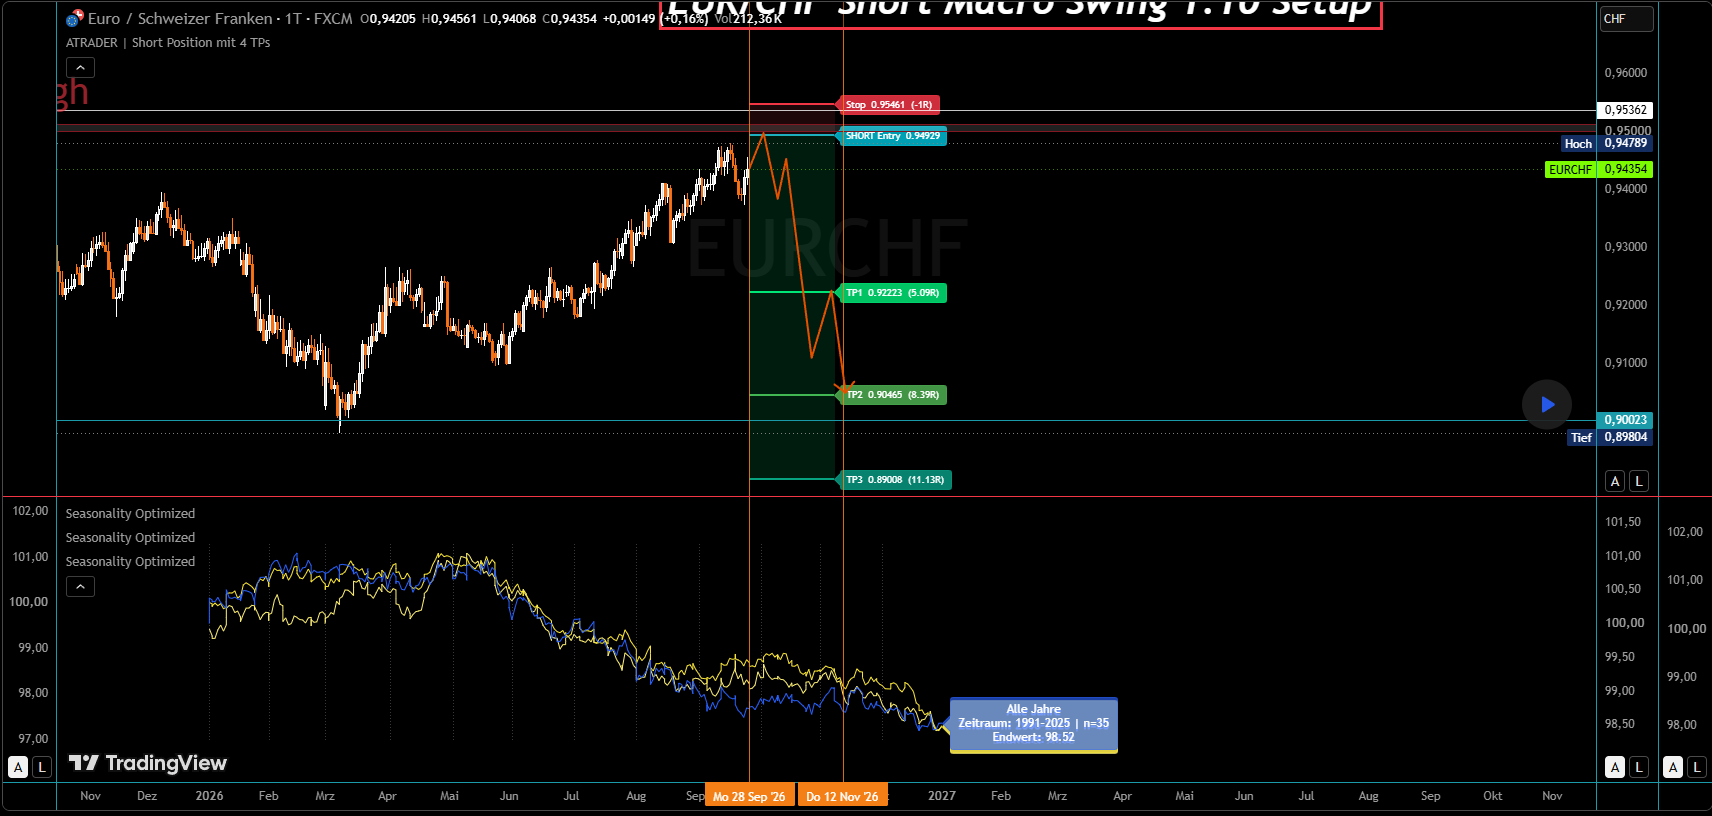
I am positioning conceptually for an EUR/CHF short through Q4 2026, with my time horizon extending into the first or second week of January 2027. I am particularly interested in the period between October 5 and October 13 as a possible starting point for a short-term reversal in the Swiss franc.
The idea combines euro positioning, seasonality and European growth risks with a second consideration:if the Swiss franc is increasingly used as a funding currency for carry trades, a later shift toward risk aversion could trigger additional CHF repurchases.
This is a conditional macro scenario, not a certain forecast. The possible migration of carry funding from JPY toward CHF is a hypothesis, not a capital flow proven by my charts.
1. Euro: COT structure and the 2023–2025 comparison
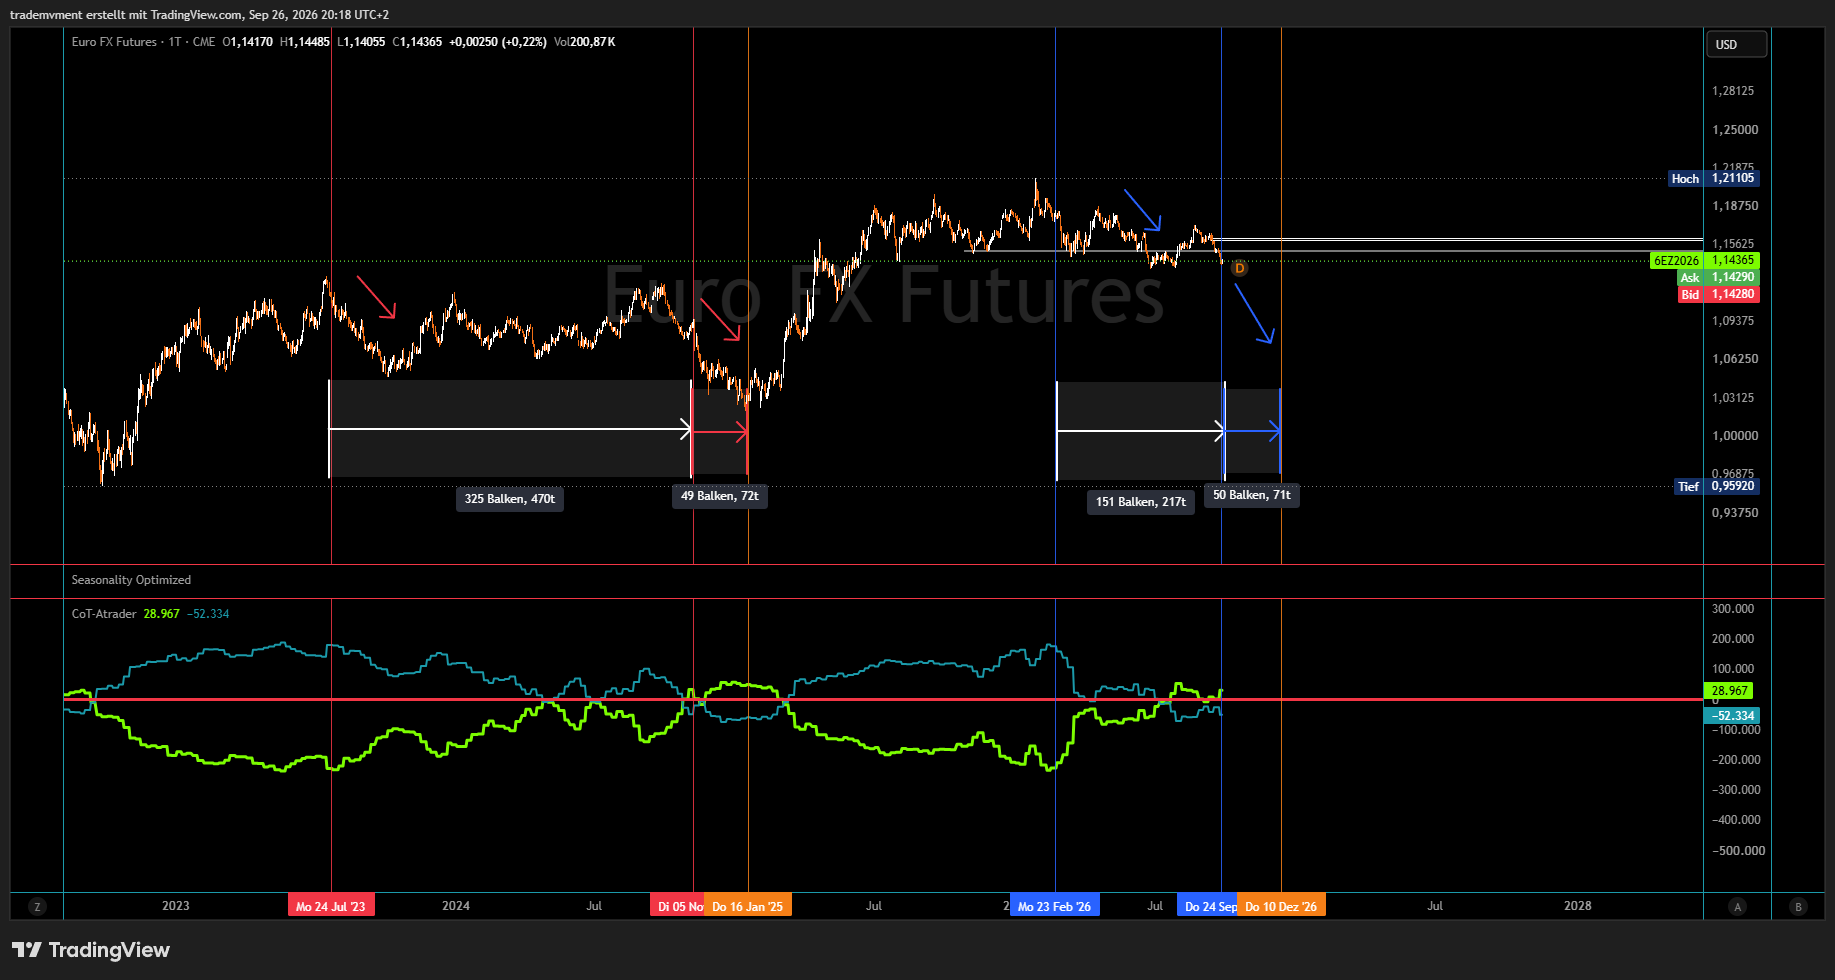
My starting point is Euro FX futures and positioning in the Commitment of Traders report.
From July 2023 onward, Commercial net positioning changed over a long period while price remained largely inside a broad trading range. The highlighted build-up phase lasted roughly 470 calendar days. Later, the upper part of that range was approached again before the euro moved materially lower.
The subsequent decline continued into January 2025 even though Commercials had already shifted further toward the long side. This matters because hedger accumulation does not prevent further downside and does not, by itself, provide a reliable reversal signal.
Since February 2026, I see a similar structure, but compressed in time. The current highlighted positioning phase covers roughly 217 days instead of around 470 days, while the lower part of the consolidation is under pressure.
If the range breakdown confirms, the next bearish impulse could develop faster. However, I do not assume that the shorter build-up automatically means a larger move or that the previous timing must repeat.
The analogy is a scenario clue, not a one-to-one replay.
Commercials mainly reflect hedging activity and should not be treated as the same thing as speculative directional conviction.
2. Euro seasonality: Support for Q4 timing
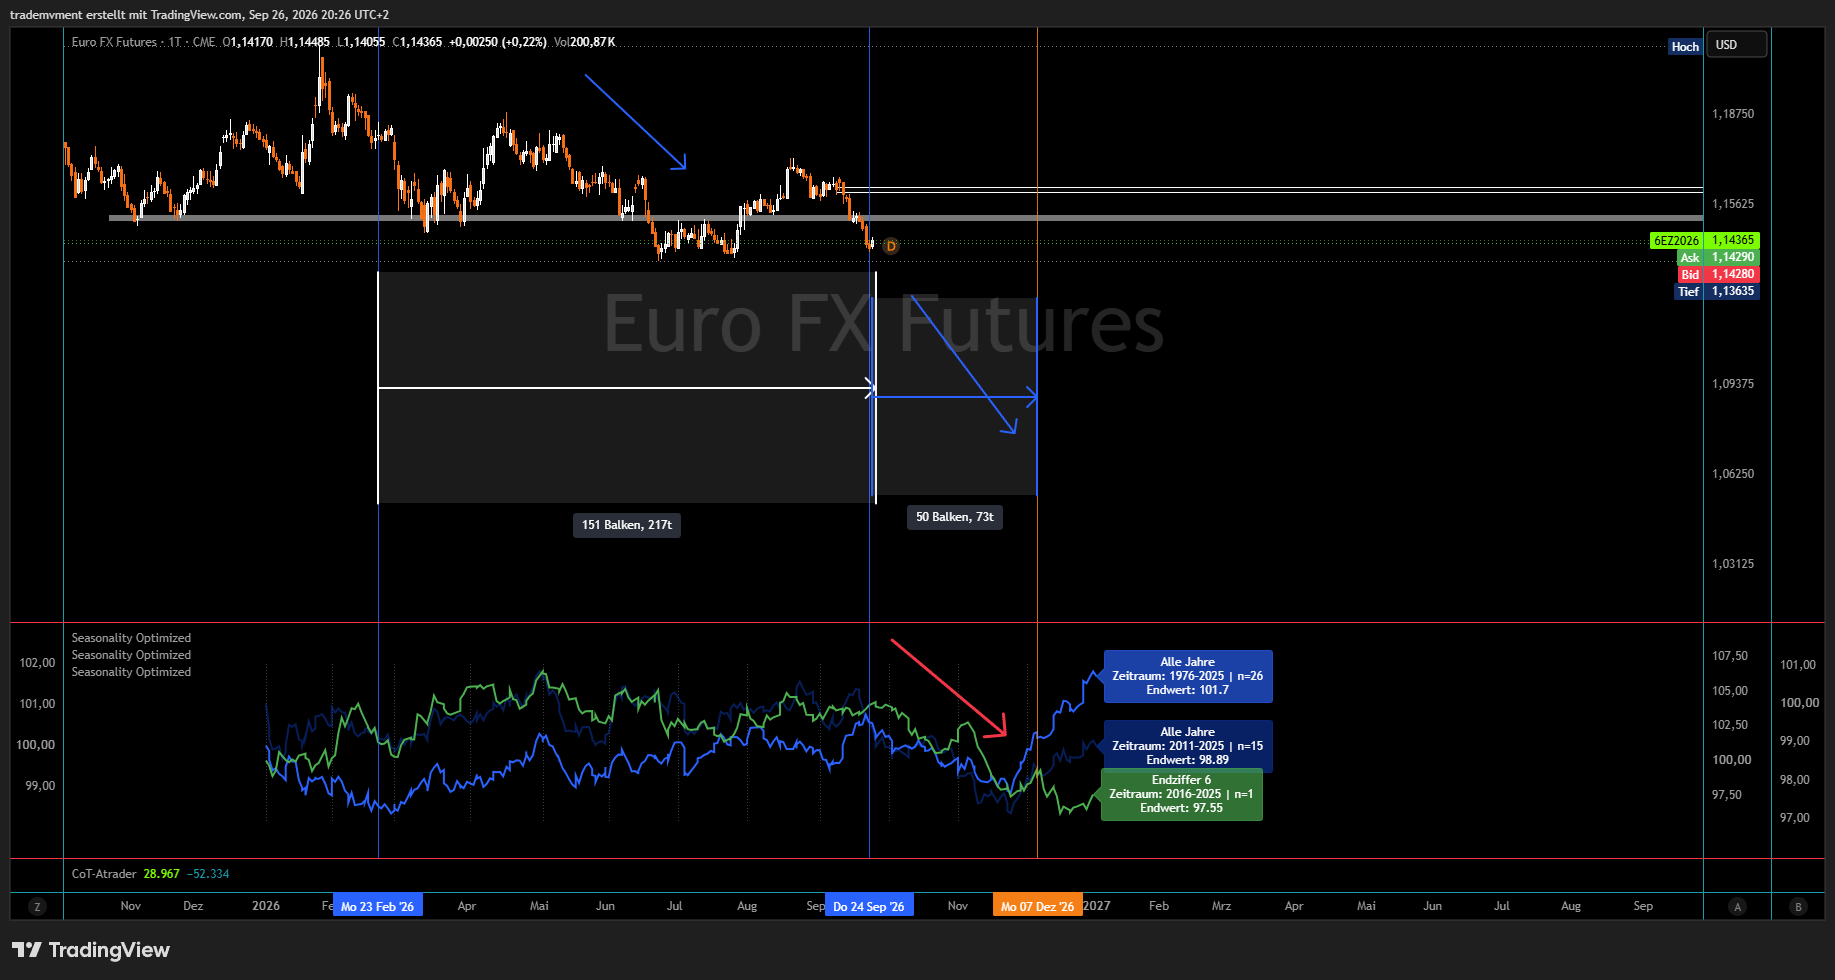
Across my seasonal comparison series, a weaker euro phase appears from late September through October and November, in some cases extending into December.
That supports the timing of my bearish euro thesis, but seasonality is not a catalyst and does not replace price confirmation. The individual seasonal series also differ in sample and path, so I treat them as contextual evidence rather than a deterministic signal.
3. Euro macro: Warning signs, but not yet a broad collapse
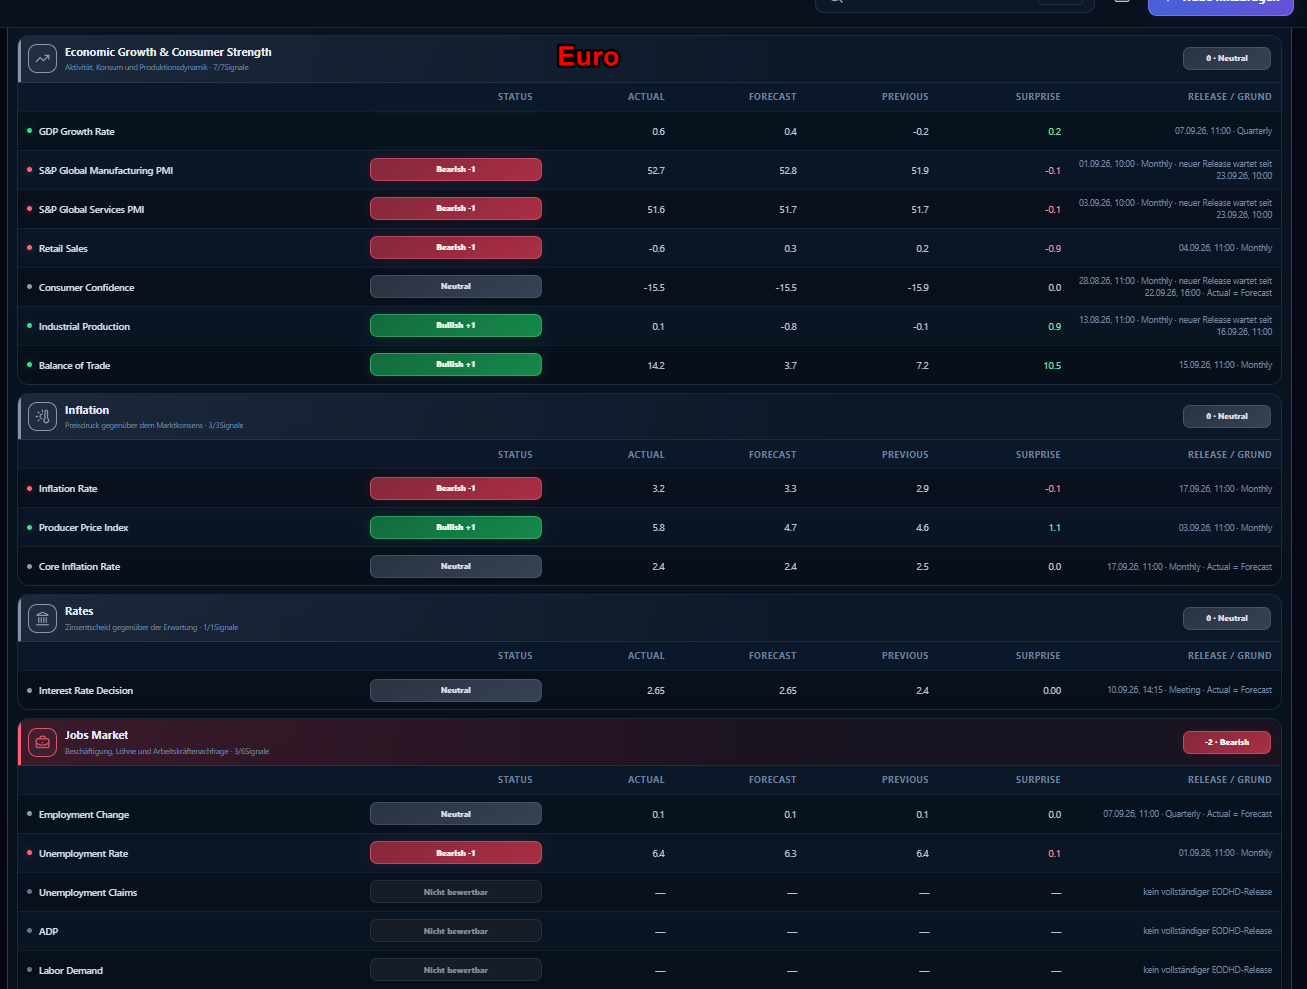
The current data is not weak enough to justify saying that the euro area is already in broad contraction.But it could ..
Manufacturing PMI stands at 52.7 versus 52.8 expected, above the previous 51.9. Services PMI is 51.6 after 51.7, also above 50. Those numbers alone do not describe a collapsing economy.
Retail sales are more concerning: -0.6 versus +0.3 expected and +0.2 previously. Consumer confidence at -15.5 matches consensus and improves slightly from -15.9. That is neutral relative to expectations, not neutral in absolute sentiment.
The unemployment rate is 6.4% versus 6.3% expected, but unchanged from the previous 6.4%. Wage growth at 3.0% is weaker than expected and weaker than before.
For me, these are early warning signals.
There are also offsets. GDP growth in the dashboard was stronger than expected, and the trade surplus was higher. So my short is not based on the claim that every euro-area indicator is already deteriorating. (but it will deteriorating !!!subjektiv opinion!!!)
Industrial production is another example where timing matters. Eurostat's September 16 release reported a 0.1% monthly decline for July, adding more recent information than the older positive dashboard reading.
Source:https://ec.europa.eu/eurostat/web/products-euro-indicators/w/4-16092026-ap
My thesis is therefore not “everything is already breaking.” It is that isolated signs of weakness could develop into a broader demand problem.
That second part is my subjective macro view
Inflation also needs to be separated carefully. Headline inflation increased from 2.9% to 3.2% in August. Coming in below a 3.3% consensus does not mean inflation itself fell. Core inflation, however, eased from 2.5% to 2.4%. Elevated producer prices also argue against declaring cost pressure fully resolved.
Source:https://ec.europa.eu/eurostat/web/products-euro-indicators/w/2-17092026-ap
For Q1–Q2 2027, I consider stronger demand-side disinflation possible: weaker consumption and activity eventually reducing price pressure after an earlier supply-driven inflation phase.
4. Energy, food and financing: My European stress scenario
My central macro idea is an overlap of pressures: high energy costs, still-restrictive financing conditions and an economy that may gradually lose resilience.
On September 10, the ECB raised its three key rates by 25 basis points. Since September 16, the deposit facility rate has been 2.50% and the main refinancing rate 2.65%.
The ECB sees upside risks to inflation and downside risks to growth. Its baseline, however, is not recession: it projects 0.9% growth for 2026 and 1.4% for 2027. My scenario is explicitly more negative than that baseline.
Source:https://www.ecb.europa.eu/press/pr/date/2026/html/ecb.mp260910~314e508016.en.html
Gas is a vulnerability argument for me, not a claim that a shortage is already inevitable.
Germany's Bundesnetzagentur describes storage levels as significantly lower than comparable periods in previous years, while still assessing current supply as stable and the risk of a strained gas-supply situation as low.
Source:https://www.bundesnetzagentur.de/DE/Gasversorgung/aktuelle_gasversorgung/start.html
My stress scenario becomes more relevant if lower storage buffers meet additional pressure from prolonged cold weather, stronger international LNG demand or supply disruptions.
In that environment, households and companies may have to spend more on energy while reducing spending elsewhere. That can weaken consumption, margins and employment at the same time.
Geopolitical action could amplify such a situation, but I am not treating deliberate behavior by any specific country as fact.
El Niño is an additional risk factor. The WMO expects the event to strengthen further. That does not automatically imply an exceptionally cold German winter or a guaranteed spike in wheat prices. Agricultural effects depend on crop, region and timing, while the wider impact can also reach global food and LNG markets.
https://www.gov.uk/government/publications/impacts-of-el-nino-on-the-uk/impacts-of-el-nino-on-the-uk
Stagflation and later disinflation are not contradictory in this framework. First, supply shocks can keep inflation elevated while growth weakens. Later, weaker demand can begin to dominate and reduce inflationary pressure more aggressively.
That transition is uncertain in both timing and magnitude.
5. Why the Swiss franc? Funding today, repurchase pressure tomorrow
The other side of this trade is not only about the Swiss economy. I am also interested in the potential role of CHF as a funding currency.
The Bank of Japan raised its target rate to around 1.25% in September, while the SNB kept its policy rate at 0% on September 24. That divergence raises the question of whether the Swiss franc could become relatively more attractive than the yen for certain carry strategies.
Sources:https://www.boj.or.jp/en/mopo/mpmdeci/mpr_2026/k260918a.pdf
https://www.snb.ch/en/publications/communication/press-releases-restricted/pre_20260924
The mechanism is simple.
Imagine an investor funds in CHF, sells those francs for USD and holds higher-yielding dollar assets. If the position is later unwound, the CHF liability must be repaid or the short CHF exposure closed. That requires buying francs back.
If that happens during a broader risk-off move, carry unwinds and safe-haven demand can point in the same direction.
The SNB itself describes the Swiss franc as a safe-haven currency.
Source:https://www.snb.ch/en/snb-explained/swiss-franc
That is why I consider CHF-funded positions a possible amplifier of a later appreciation move.
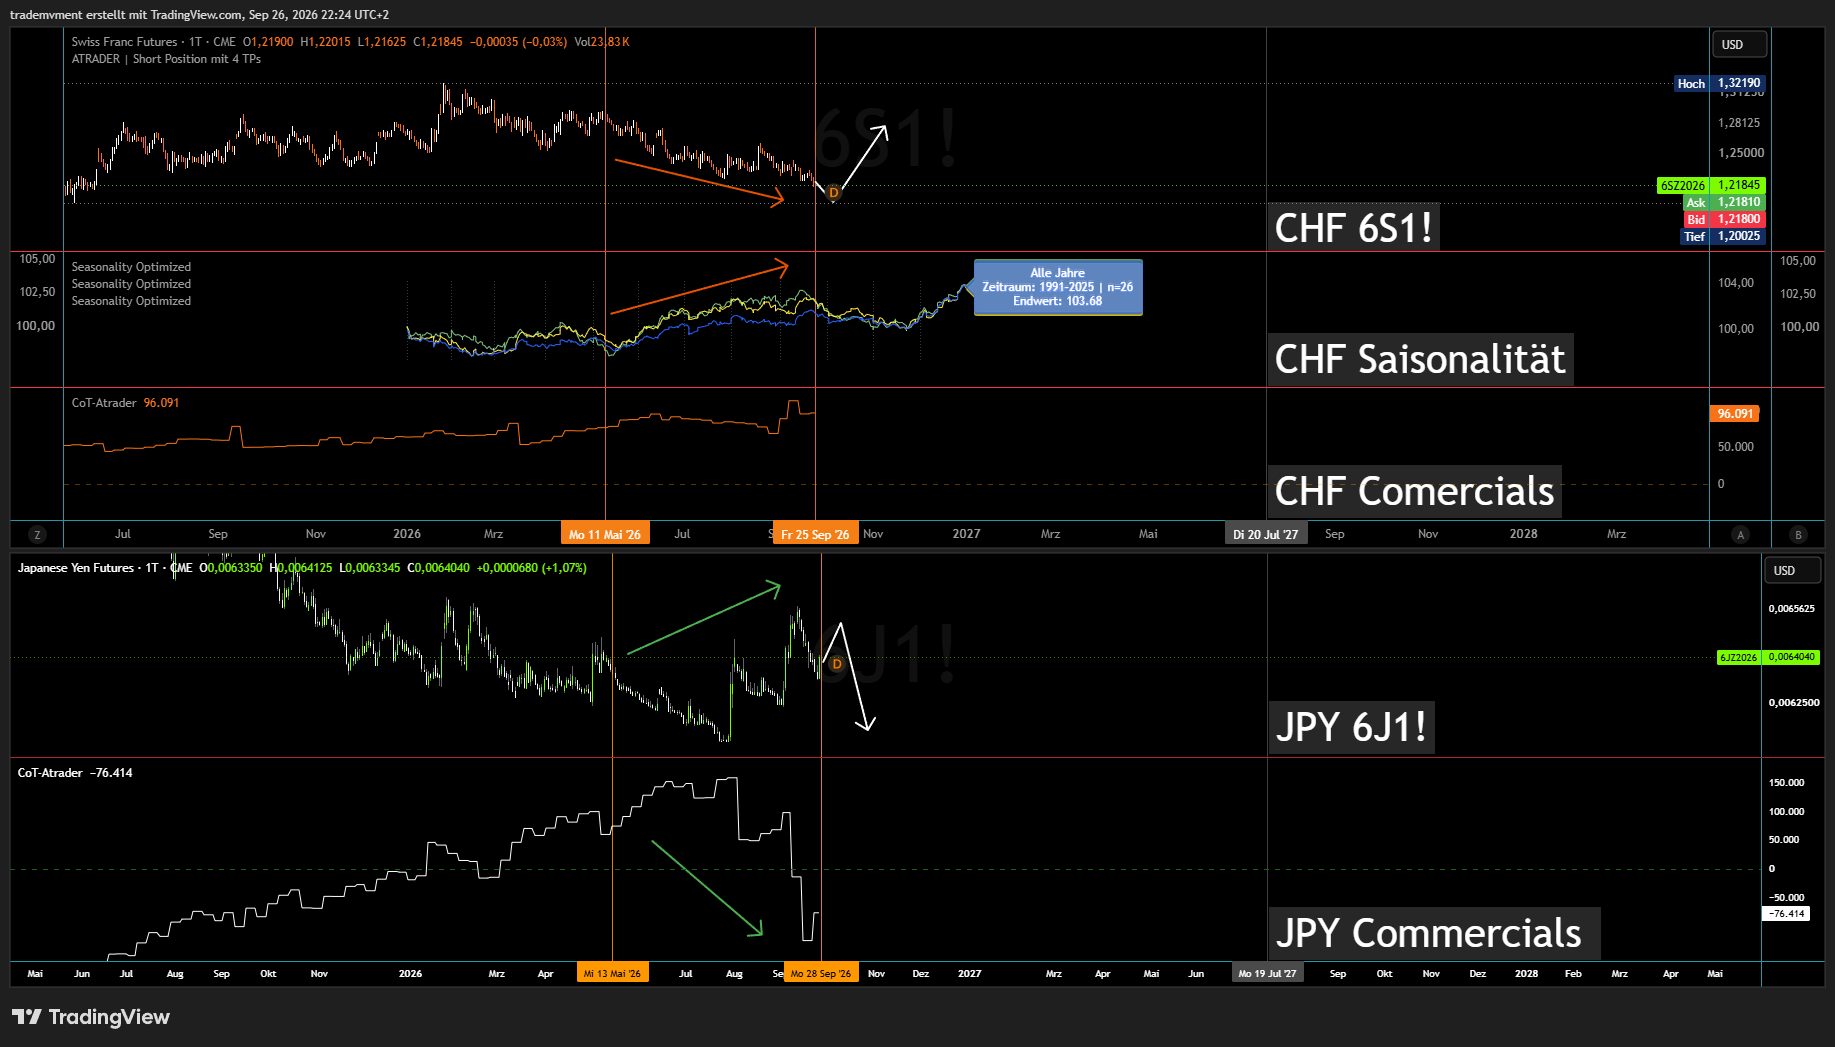
The comparison chart shows notable CHF weakness relative to the seasonal paths. At the same time, CHF and JPY Commercial positioning have developed differently.
The SNB offers a finding that is compatible with this idea without proving it. Since its June policy assessment, the franc has depreciated by roughly 3% on a trade-weighted basis, which the SNB links to wider interest-rate differentials versus other currency areas.
That is consistent with a carry incentive, but it does not prove that investors are actively replacing JPY funding with CHF funding.
Source:https://www.snb.ch/en/publications/communication/speeches-restricted/ref_20260924_mslanmargpe
The decline in JPY Commercial positioning is also not proof of such a migration. Hedgers can reduce exposure while speculative participants buy yen. Higher Japanese rates therefore do not mechanically imply higher Commercial net longs.
6. CHF COT: Gross longs are not the same as net longs
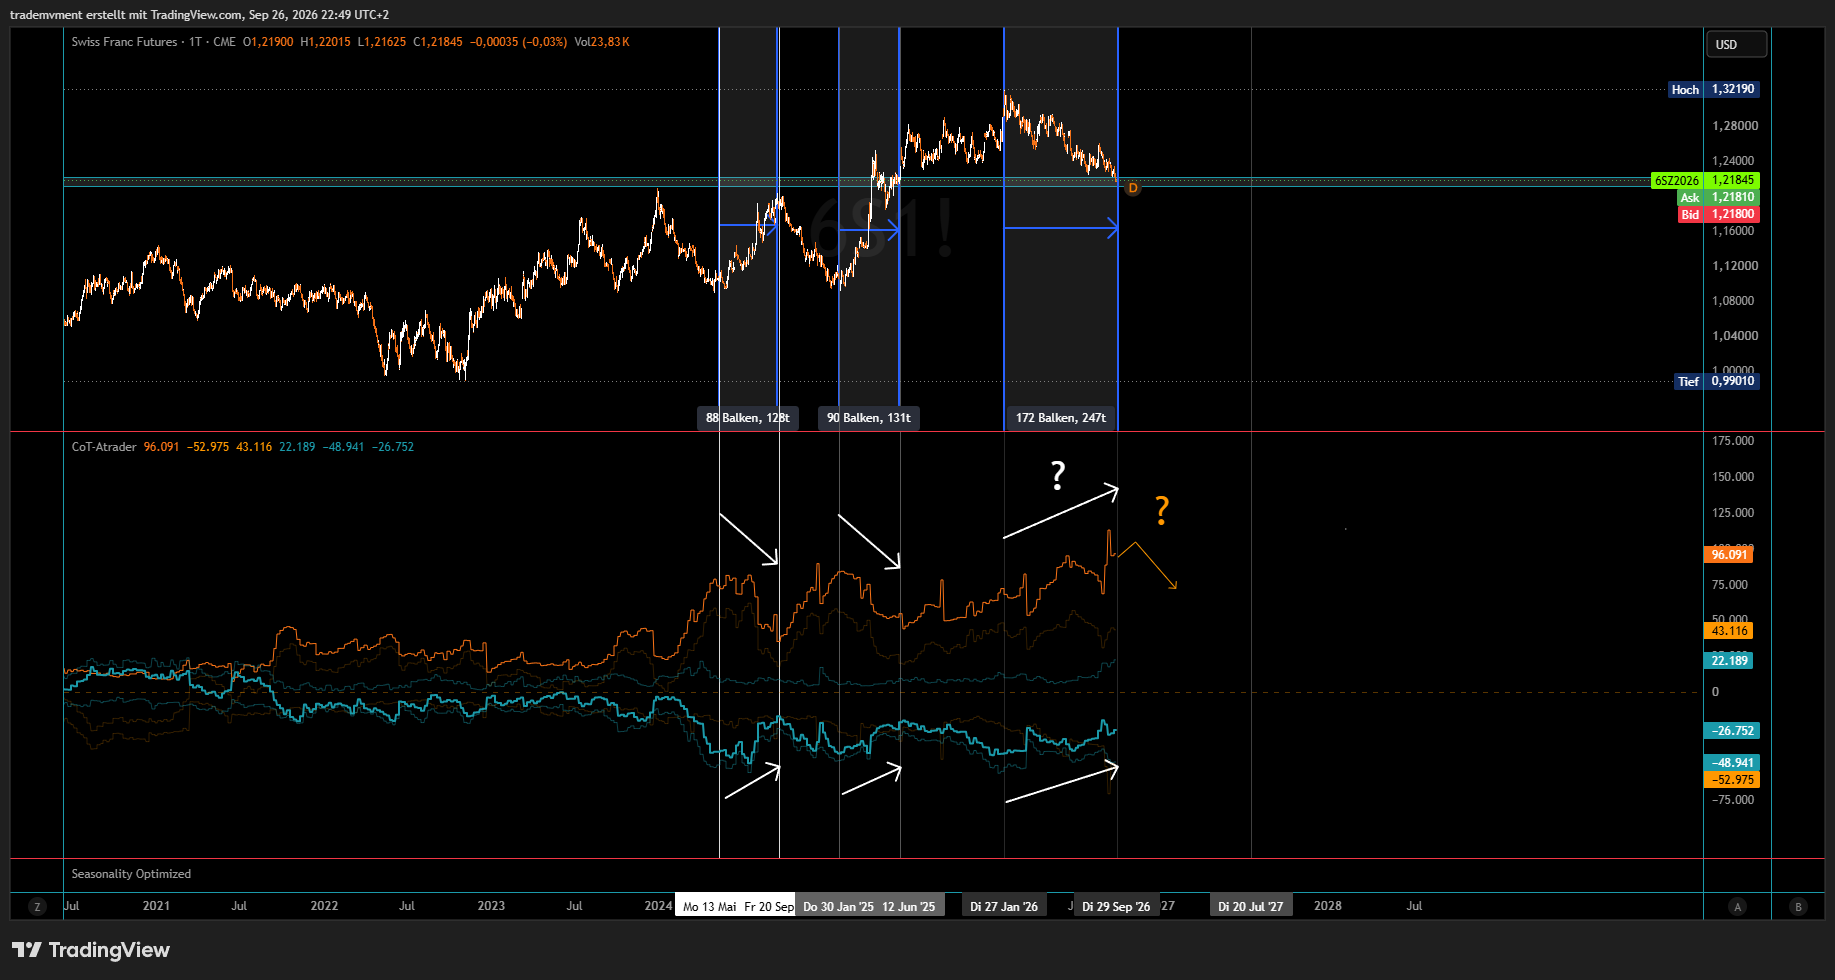 The chart compares two earlier phases of roughly 130 days each with the current highlighted phase of around 247 days.
The earlier periods coincided with clear CHF strength. The current phase is different, with price and positioning series diverging more.
The important distinction is between gross long exposure, gross short exposure and net positioning.
Commercials: 96,091 long minus 52,975 short = 43,116 contracts net longNon-Commercials: 22,189 long minus 48,941 short = 26,752 contracts net shortThe highlighted 96,091 figure in my other chart is therefore a gross long position, not the Commercial net position.
Likewise, rising speculative longs do not mean Non-Commercials are already net long.
For the carry-unwind thesis, the remaining speculative net-short position is particularly interesting.
If the trend reverses, that short exposure can create repurchase pressure. What COT cannot tell me by itself is whether those positions are large enough, leveraged enough or genuinely carry-driven enough to produce a violent unwind.
The absolute contract count also needs to be compared with Open Interest and with its own historical range.
And COT still represents only one part of the FX market.
7. BIS: The mechanism exists, but it does not confirm my timing
BIS Bulletin No. 124 from May 6, 2026 examines how carry positioning can amplify exchange-rate reactions to monetary policy surprises.
The authors find stronger appreciation reactions in CHF and JPY after unexpected monetary tightening when those funding currencies had previously accumulated substantial speculative short positions. Closing those shorts can amplify the move.
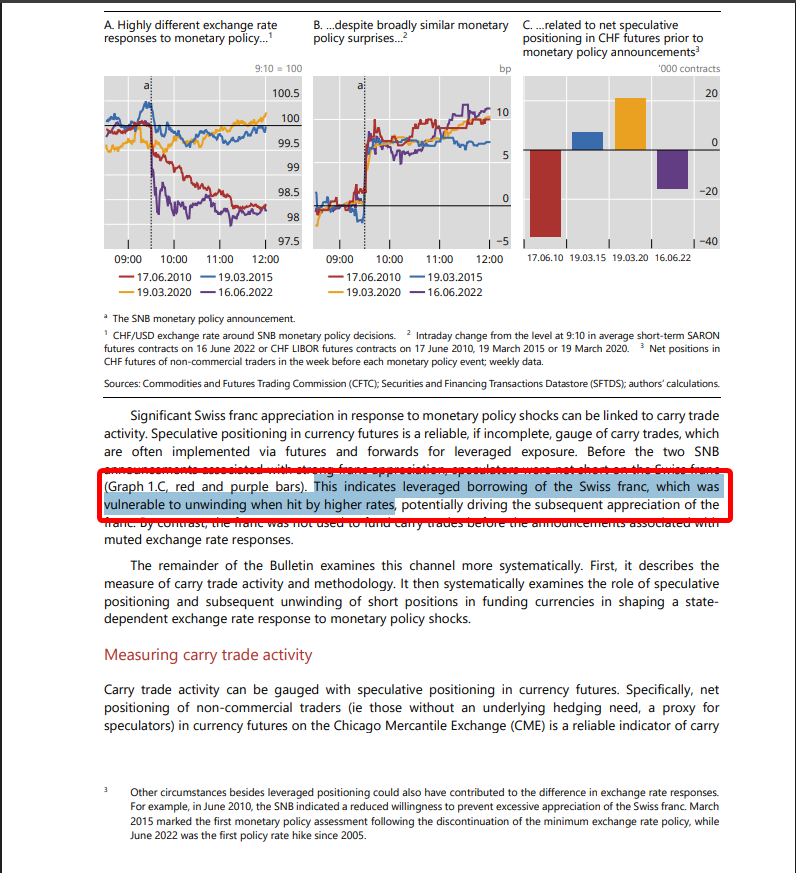
This supports the amplification mechanism. It does not prove a current JPY-to-CHF funding shift and it does not predict an October CHF squeeze.
The BIS analysis focuses particularly on unexpected monetary tightening. Extending that mechanism to a broader risk-off shock is my additional hypothesis.
The SNB's current zero-rate policy is also not itself such a tightening shock.
8. Swiss macro: Relatively resilient, but not isolated
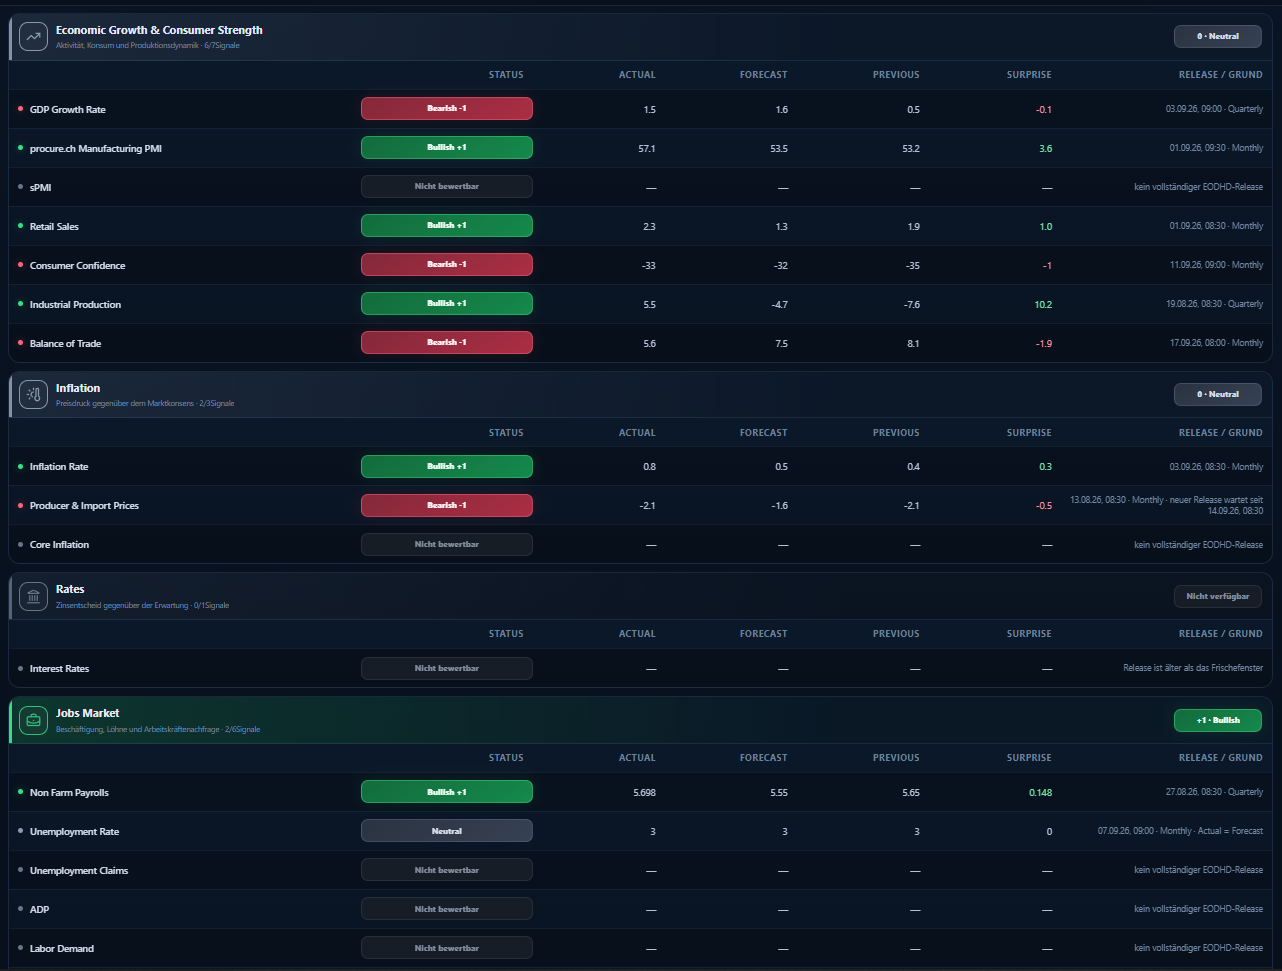 The Swiss macro picture is comparatively strong in several areas.
Manufacturing PMI stands at 57.1 versus 53.5 expected. Retail sales growth is 2.3 versus 1.3 expected. Industrial production is 5.5 versus -4.7 expected. Employment also beats expectations, while unemployment is reported at 3.0%.
At the same time, GDP, consumer confidence and the trade balance disappoint relative to their respective forecasts.
Inflation at 0.8% is above the 0.5% consensus shown in the dashboard. That 0.5% is the estimate, not the previous reading; the previous figure was 0.4%.
The SNB describes Q2 growth as exceptionally strong, partly because of chemicals and pharmaceuticals. Even excluding that effect, it says growth remained solid and broad-based. At the same time, it points to below-average capacity utilization and some deterioration in unemployment through early summer.
Source:https://www.snb.ch/en/publications/communication/press-releases-restricted/pre_20260924
My point is therefore not that Switzerland is immune to Europe. It is that CHF could still become relatively more attractive in a European stress scenario without requiring a Swiss economic boom.
The SNB remains an important counter-risk.
It keeps the option of FX intervention open. That does not mean it has a permanent objective of keeping CHF weak at all costs. The relevant constraints are price stability and appropriate monetary conditions.
So even in my favorable scenario, I would expect volatility and possible intervention risk rather than a clean one-way move.
9. CHF seasonality: October 5–13 is my observation window
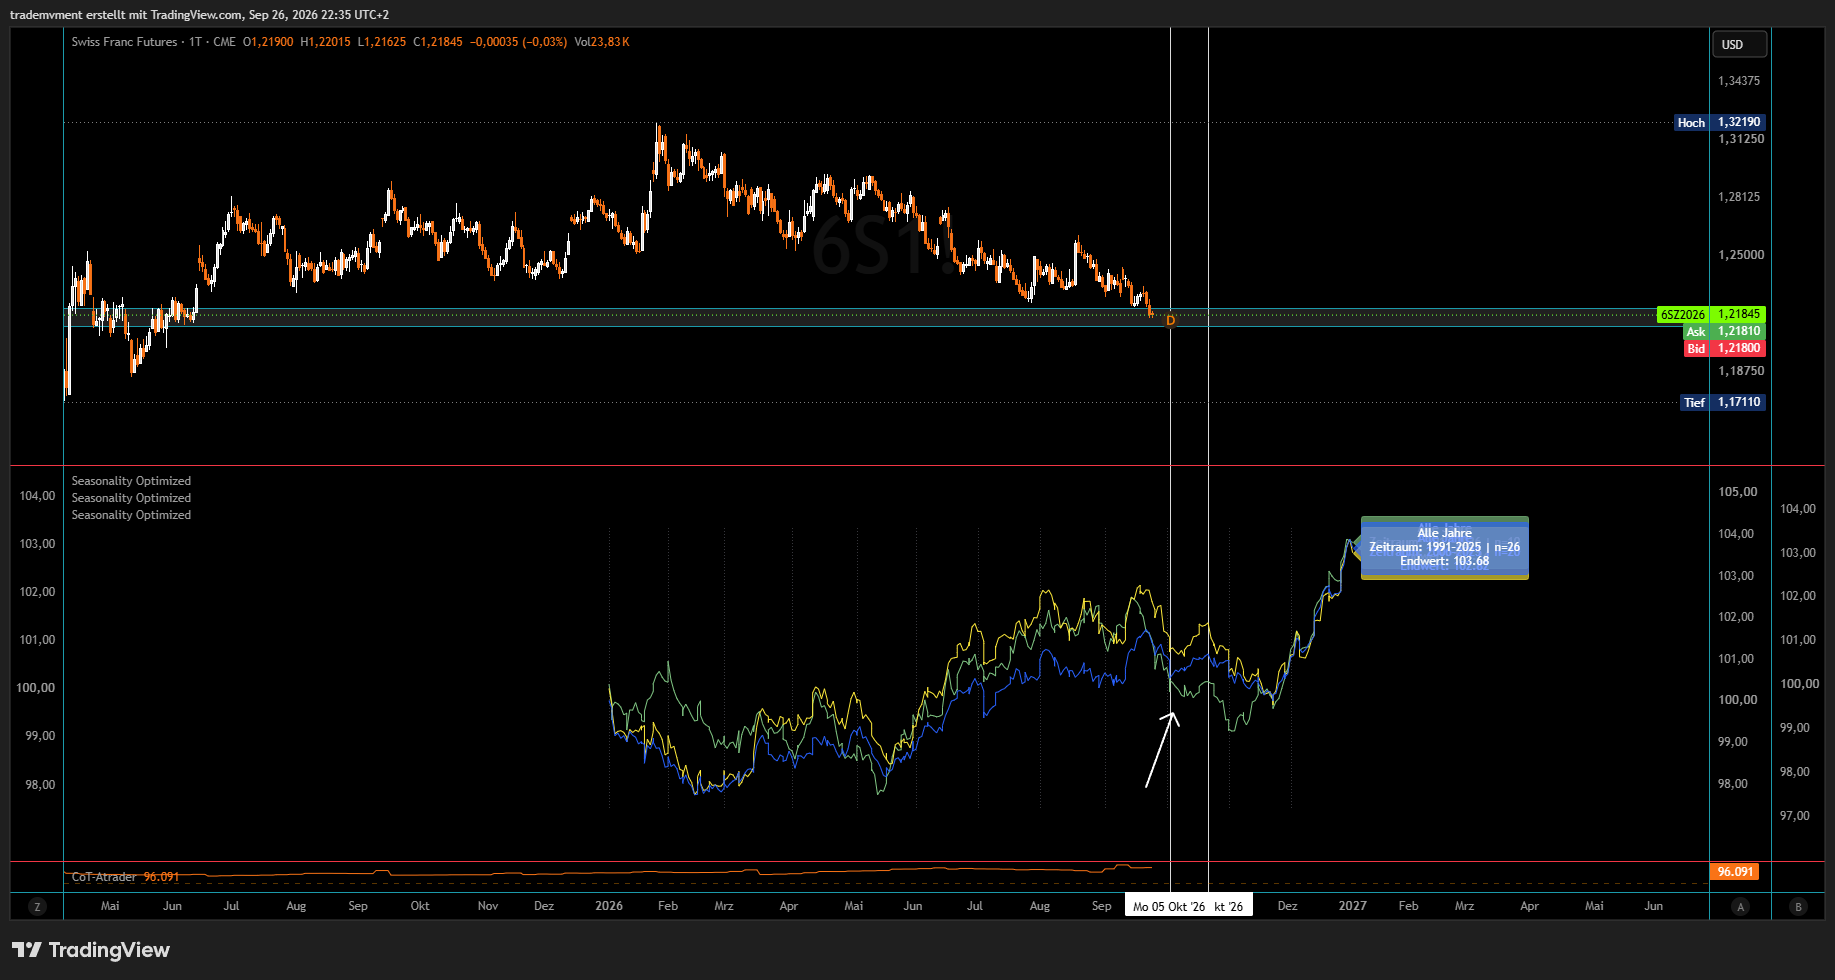
Across the seasonal comparison series, I see a possible short-term CHF reversal zone in early to mid-October.
The period I am watching most closely is October 5 to October 13.
The important limitation is that the seasonal lines do not show a uniform rally continuing all the way into January.
So I use this window as a potential starting point for an impulse, not as proof of a multi-month CHF trend.
10. Historical EUR/CHF examples: Context, not a crash clock
https://www.tradingview.com/x/KPNS3zkA/
The first chart marks October 8, 2007 near a major high. A substantial EUR/CHF decline followed.
For me, this is useful mainly as an illustration of how large a relative repricing between EUR and CHF can become.
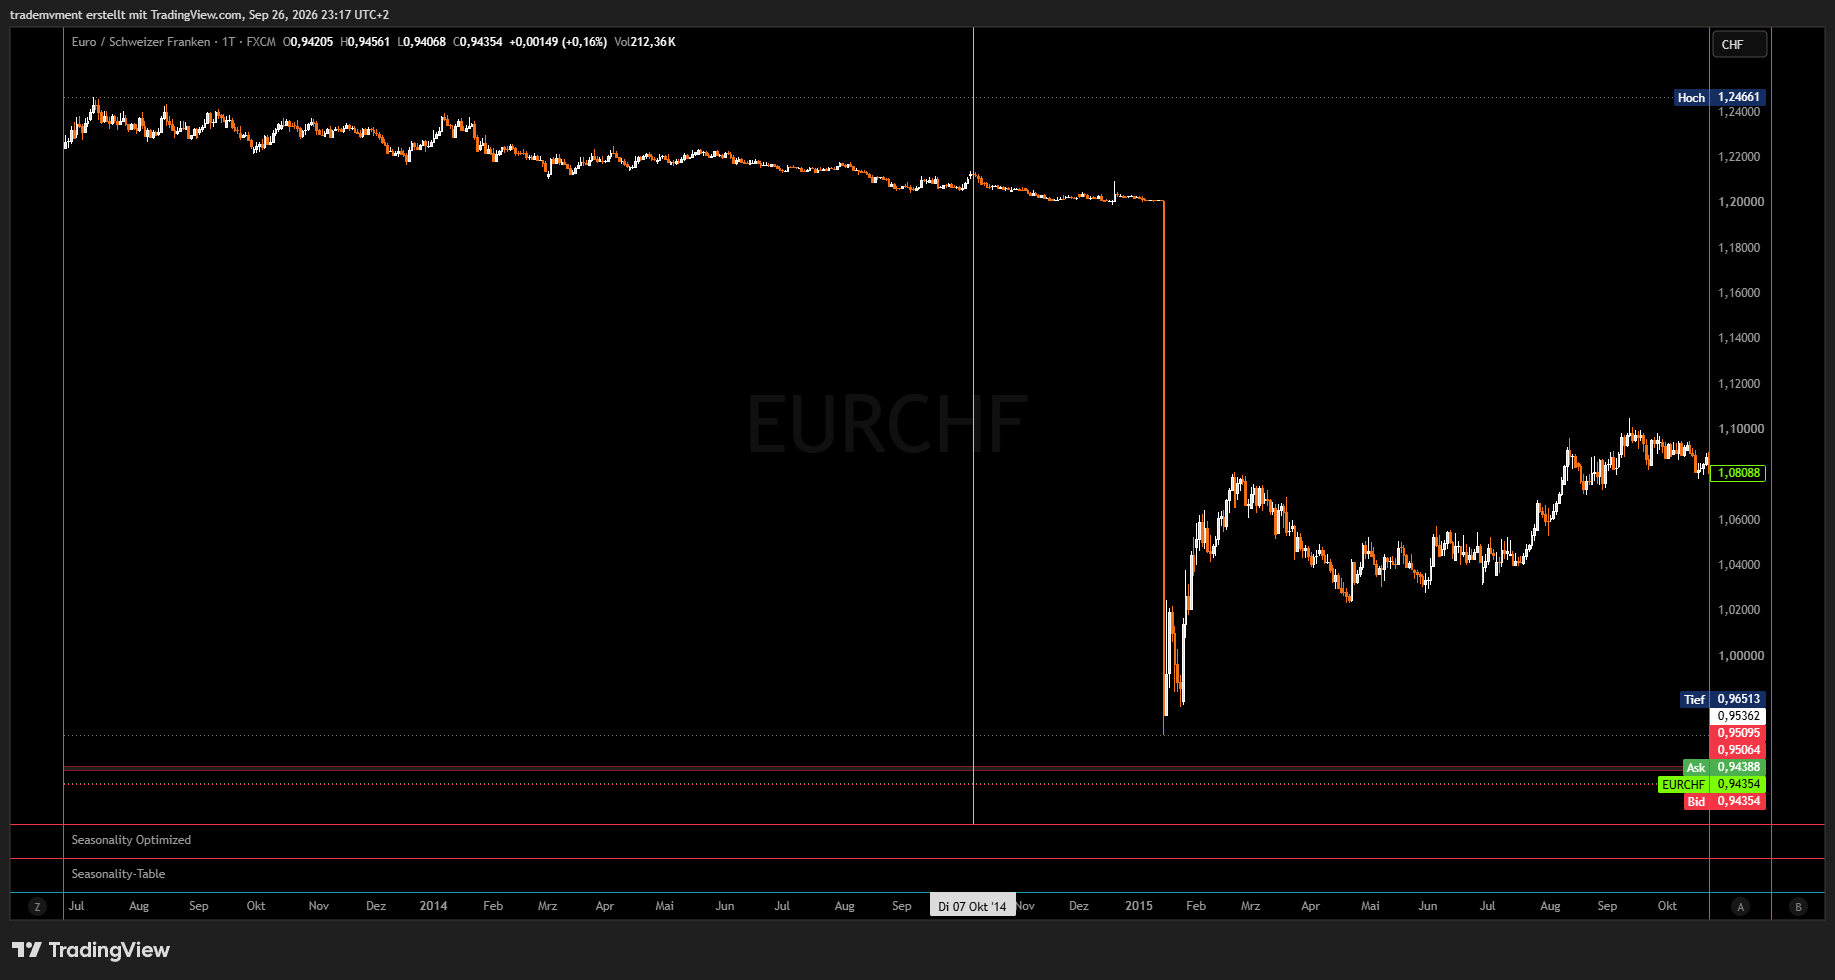
The second chart highlights a local high in early October 2014. EUR/CHF then moved lower before the SNB abandoned the 1.20 EUR/CHF floor on January 15, 2015, producing an extraordinary market move.
Source:https://www.snb.ch/en/publications/communication/press-releases/2015/pre_20150115
I am not assuming a repeat of that event.
The lesson is more general: when a currency regime changes abruptly, liquidity and execution matter more than a perfect projected target.
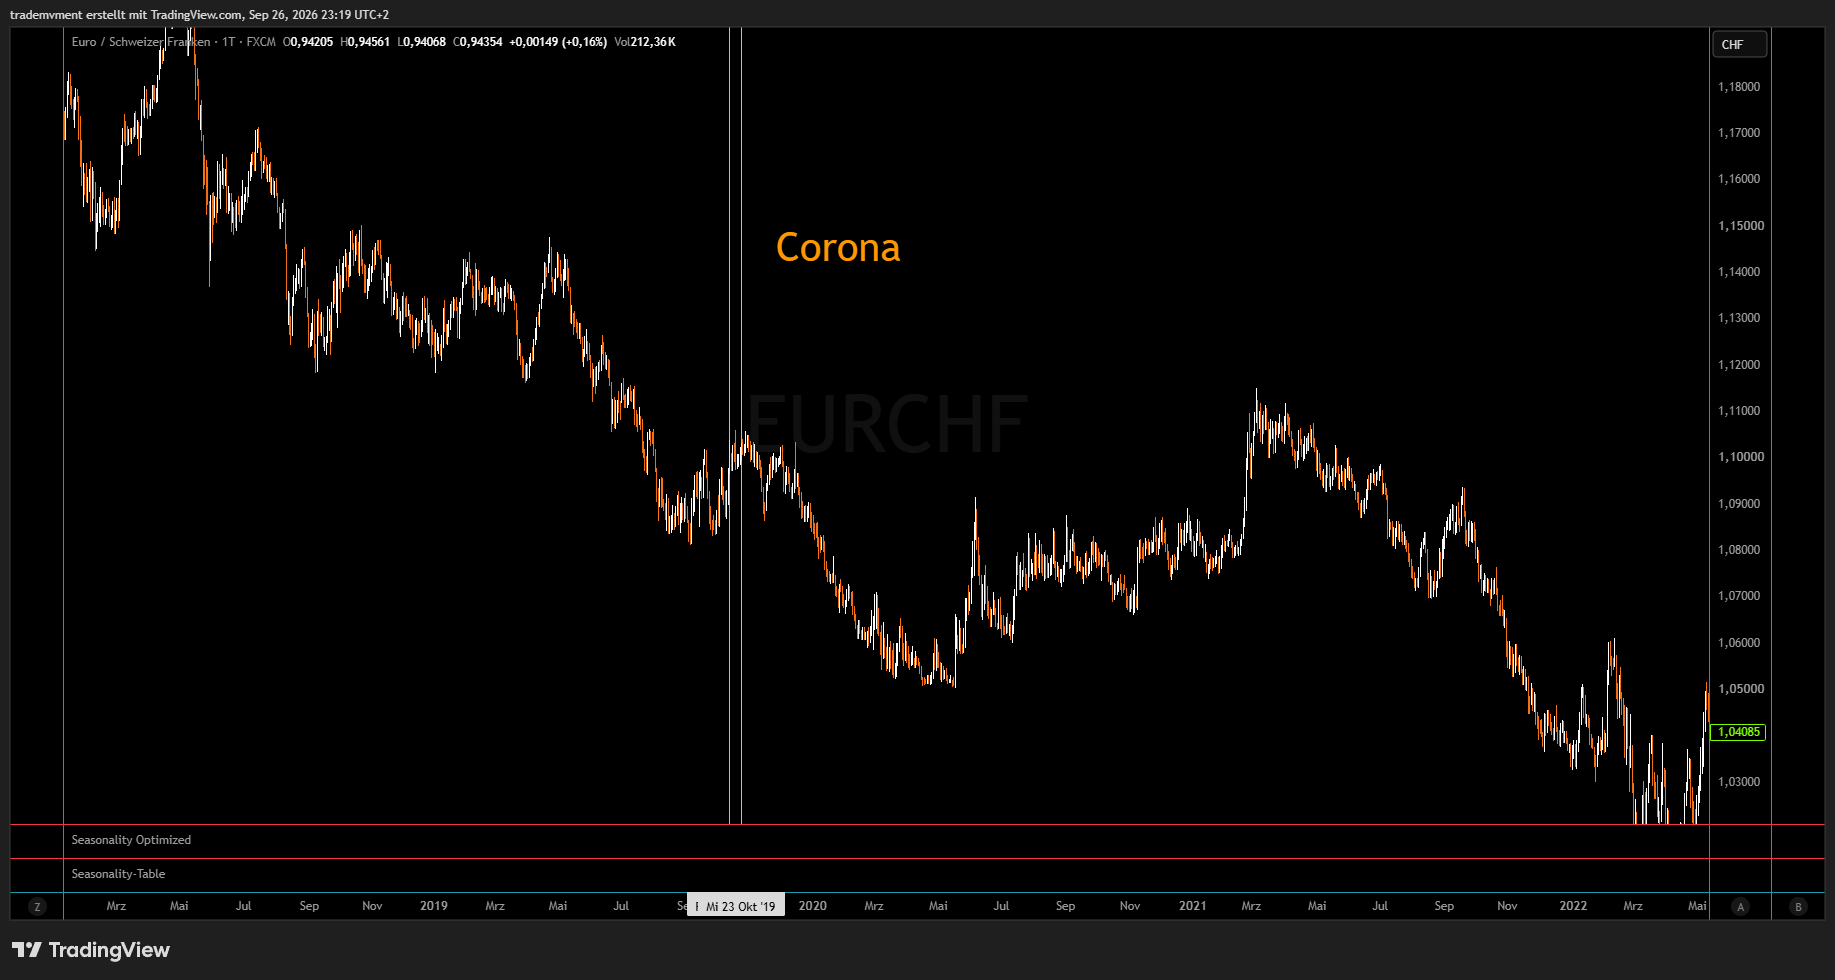 The third chart shows a local high around October 23, 2019 followed by a decline into spring 2020.
That move began before the later pandemic shock, so it cannot simply be explained retroactively by COVID.
These charts help me visualize possible paths. They are not a statistical study proving that the next major EUR/CHF decline must begin in October.
11. Connection to my WTI thesis
My previous WTI analysis:
https://de.tradingview.com/chart/XTIUSD/4hwBlSVs/
is based on a transition from supply-driven inflation pressure toward demand-driven weakness.
An energy shock first hurts purchasing power, margins and financing conditions. If that pressure persists, the economic damage can eventually weaken commodity demand itself.
That can fit an EUR/CHF short if the market simultaneously starts pricing weaker European growth and greater risk aversion.
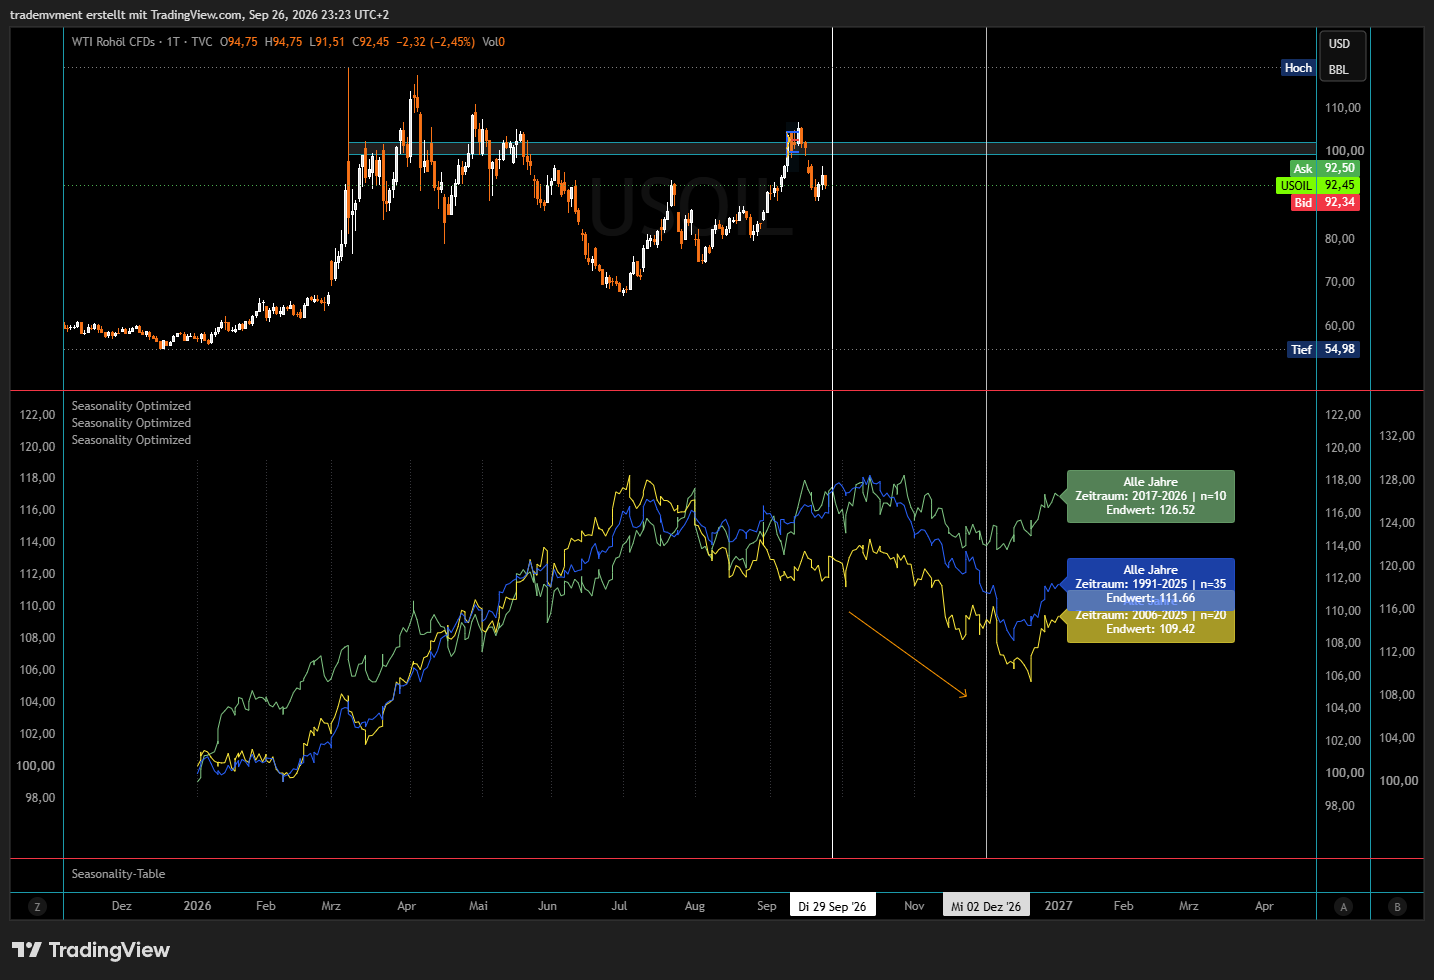
The longer WTI seasonal comparison series also show weakness later in the year. The more recent series is less clear, so I do not treat all lookbacks as equally strong evidence.
Falling oil is not automatically bearish for the euro.
If oil falls because supply improves, that can help Europe by lowering costs and improving purchasing power.
If oil falls because global demand is weakening sharply, it fits my stress scenario much better.
High European gas prices and falling WTI can also coexist because the two markets are not identical.
For me, the cause of the oil move matters more than the direction alone.
12. Technical implementation
The main chart shows a planned short entry after another retracement into the upper price area. I am not assuming that the order has already been filled.
My trade horizon extends into early or mid-January 2027.
The macro effects discussed above could persist longer, but that does not mean I must hold this specific position for the entire macro cycle.
The thesis loses weight if Europe's energy situation improves, consumption and labor remain resilient and inflation falls without major growth damage.
In that case, euro rate support could persist longer than I expect.
Stable global risk appetite, continued CHF carry funding and an effective SNB response would also work against the trade.
If the October timing window passes without confirmation from price and the broader environment, I would need to reassess the timing.
Conclusion
I am looking for a combination of European growth disappointment and additional appreciation pressure on the Swiss franc.
The key is the relative move.
The euro needs to weaken against the franc. I do not need a guaranteed crash, and I do not need Switzerland to be completely insulated from global problems.
My scenario is simply that Europe weakens enough for the euro side to deteriorate while CHF gains an additional layer of demand through safe-haven flows, short covering and potentially a partial carry unwind.
That combination is what makes EUR/CHF interesting to me into Q4 2026 and potentially into early 2027.
And yes:
Apparently some old piece of paper from the 19th century also thinks 2026 might not be particularly great for risk
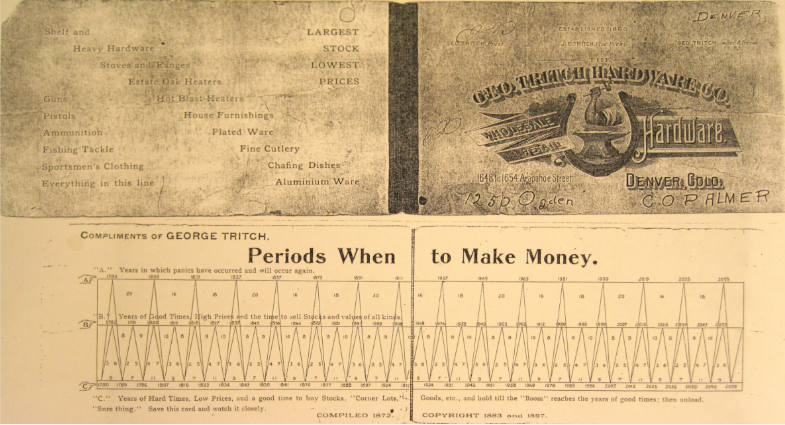 Probably could have used that as the entire analysis. :)






