





GBP/USD

Jun 09, 2014 at 08:16
848 Tampilan
3 Balasan

Menjadi Anggota Sejak Apr 08, 2014
1140 postingan
Jun 09, 2014 at 08:16
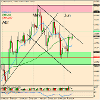
GBPUSD on the daily chart, the price is moving down along with a bearish trend. On the break of the trend line around 1.6850, we should see an upward thrust.
Lampiran:
"I trade to make money not to be right."

Menjadi Anggota Sejak Oct 11, 2013
769 postingan
Jun 11, 2014 at 20:03
More oscillations of the GBPUSD around the 1.6800 level. No clear entries until it leaves this zone with a clear direction.
Menjadi Anggota Sejak Apr 08, 2014
1140 postingan
Jun 12, 2014 at 10:26
(diedit Jun 12, 2014 at 10:26 yang lalu)
A quick update:
Looks like is pushing through the 50 day SMA and breaking to the upside the downward channel. GBPUSD may be want to test the 1.69 level.
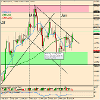
Looks like is pushing through the 50 day SMA and breaking to the upside the downward channel. GBPUSD may be want to test the 1.69 level.
Lampiran:
"I trade to make money not to be right."

*Penggunaan komersial dan spam tidak akan ditoleransi dan dapat mengakibatkan penutupan akun.
Tips: Memposting URL gambar/YouTube akan otomatis menyematkannya di postingan Anda!
Tips: Ketik tanda @ untuk melengkapi nama pengguna secara otomatis yang berpartisipasi dalam diskusi ini.





