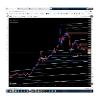
GOLD DAILY CHART 07-06-2026
Gold has been making lower highs and lower lows since the major top around 5,300–5,500. Price is trading below the recent supply zones (red blocks), showing sellers remain in control. The blue demand zone around 4185–4220 is the next major support and coincides with: Previous consolidation area. Lower boundary of your rising channel. A visible liquidity/support region. Week Ahead Scenarios
Bearish case (slightly favored)
If price stays below 4400–4470, sellers remain in control. A break below the recent low around 4275–4300 could quickly send price into the 4185 area. I would not be surprised to see a liquidity sweep below 4185 before a larger bounce. Bullish case
If buyers defend current levels and reclaim 4470–4520, gold could revisit: 4700 zone Then 4800 supply Bulls need a daily close above those resistance areas to change the structure. About 4185
I agree that 4185 is a logical magnet on this chart.
However, support zones are rarely exact numbers. I would view it as:
4185 ± 20–30 points
and watch for:
Rejection wicks, Bullish engulfing candles, Volume increase, before assuming a major reversal.
My bias for next week
60% bearish / 40% bullish
First target: 4250–4200 Key support: 4185 If 4185 breaks decisively on a daily close, the next downside area appears near 4000–3950 from the chart structure.
Pick your pennies and go home