




Why same company stock charts(price curves) looks different?
Sep 16, 2019 at 10:15
1,286 Tampilan
3 Balasan

Menjadi Anggota Sejak Mar 11, 2014
3 postingan
Sep 16, 2019 at 10:15
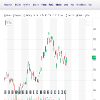
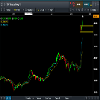
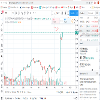
Does anyone know why stock charts looks different depending on the broker you use? I mean; same company two totally different charts(price curves). I added two charts here, hopefully they're visible. Both pictures are weekly charts and company is TCF FINANCIAL CORP. They look totally different in cmc markets compared to chart on finance.yahoo.com
Lampiran:
Menjadi Anggota Sejak Sep 16, 2019
10 postingan
Sep 16, 2019 at 10:48
You sure they are the same company? The prices are different too
Menjadi Anggota Sejak Mar 11, 2014
3 postingan
Sep 16, 2019 at 10:57
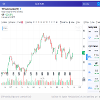
here is a better picture where you can see the name of the company
Lampiran:

*Penggunaan komersial dan spam tidak akan ditoleransi dan dapat mengakibatkan penutupan akun.
Tips: Memposting URL gambar/YouTube akan otomatis menyematkannya di postingan Anda!
Tips: Ketik tanda @ untuk melengkapi nama pengguna secara otomatis yang berpartisipasi dalam diskusi ini.