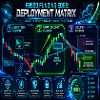
The Liquidity Reaction Framework: Deconstructing Acceleration & Deceleration at Key Zones
Hello everyone,
I want to open up a transparent, technical workshop on a core paradox in systematic trading: Why are mechanically simple frameworks often the most operationally difficult to execute?
Many operators spend years chasing lagging retail indicator clusters, failing to realize that commercial algorithms operate entirely on the delivery of price into resting liquidity zones. To address this, I want to introduce the foundational delivery logic of the FB500 Funding Edge Strategy (https://forexbroker500.com/prop-firm-passing-strategy-fb500-funding-edge/).
The mechanics themselves are incredibly straightforward, but the strict behavioral discipline required to execute them under tight prop firm trailing drawdown boundaries is where most traders break down.
The Deployment Matrix: Analyzing the ApproachInstead of relying on conventional market structure shifts, this framework strips away retail branding and focuses purely on velocity behavior as price approaches a defined higher-timeframe liquidity pool (like a previous daily high/low or major session boundary).
We categorize price delivery into two distinct operational phases:
The Decelerating Approach: As price nears our targeted liquidity zone, we want to see a clear loss of momentum on the lower timeframes—compressing candle bodies, overlapping wicks, and failing volume. This signals that retail buyers or sellers are being induced into taking positions early.The Accelerating Purge: The moment price enters the liquidity zone, the velocity must completely shift. We look for a rapid, aggressive candle surge that sweeps the resting stops. This is followed immediately by an Instant Deployment Reaction—leaving behind a sharp, clean Primary Deployment Gap (imbalance).
Strict Directional Trigger ConditionsTo eliminate all room for emotional bias or guessing, execution is governed by binary rules. We only look for execution when the following alignment occurs:
🟩 When to BUY (Long Position Deployment)The Target: Price approaches a major Higher-Timeframe Liquidity Pool below the market (e.g., Previous Daily Low or Session Lows).The Behavior: A Decelerating Approach compresses downward into the zone, followed by an Accelerating Purge that sweeps the resting sell-stops.The Trigger: A sharp upward displacement candle forms, leaving a valid Primary Deployment Gap above the swept low.The Execution: Set a Buy Limit order strictly inside the Discount Zone (below the 50% equilibrium mark of the reaction leg). Invalidation (Stop Loss) is set right below the absolute low of the accelerating purge candle.🟥 When to SELL (Short Position Deployment)The Target: Price approaches a major Higher-Timeframe Liquidity Pool above the market (e.g., Previous Daily High or Session Highs).The Behavior: A Decelerating Approach compresses upward into the zone, followed by an Accelerating Purge that sweeps the resting buy-stops (breakout traps).The Trigger: A sharp downward displacement candle forms, leaving a valid Primary Deployment Gap below the swept high.The Execution: Set a Sell Limit order strictly inside the Premium Zone (above the 50% equilibrium mark of the reaction leg). Invalidation (Stop Loss) is set right above the absolute high of the accelerating purge candle.The Purpose of This Thread: Live Case StudiesThe hardest part of this framework isn't mapping the zones; it's the real-time waiting phase, and waiting becomes infinitely easier when you develop an eye for raw price velocity. If price expands without pulling back into our strict premium/discount boundaries, the trade is discarded. No chasing.
I want this thread to act as a live, collaborative visual lab. Instead of talking in pure theory, let's look at live data. I want to invite thread followers to actively participate by posting screenshots of their charts whenever they spot a clean reaction.
How to Reply and Participate:When you spot an active setup on MT5 or TradingView, drop a chart screenshot in the replies below and label the key components:
Show us the Liquidity Zone you were tracking.Identify if the market showed a Decelerating Approach or an Accelerating Purge.Point out where the Primary Deployment Gap formed after the sweep and where your limit order is nested.I will be actively jumping into the replies to critique your chart markups, break down the structural efficiency, and help refine your execution eye in real time. I’ve pinned our complete structural blueprint and mathematical risk charts over on my profile timeline as a baseline reference for mapping these dealing ranges cleanly.
Drop your current watchlists below. Let's start tracking the next major liquidity alignment together!