Maharsh Doshi (By Soul_Shadow )
| Gain : | +1214.45% |
| Drawdown | 65.95% |
| pips: | 365817.0 |
| Trades | 9219 |
| Won: |
|
| Lost: |
|
| Type: | Real |
| Leverage: | 1:500 |
| Trading: | Automated |
Maharsh Doshi Discussion


everyone are welcome to discuss on this

With almost 7,000 trades there is enough data to analyse the system properly, but 65.95% drawdown is very high compared with the gain.
I would split the results by symbol, long and short direction, session and year. This can show whether one part of the system creates most of the profit while another part creates most of the drawdown.
Because it trades frequently, commission and spread stress tests are also important. I would compare balance drawdown with equity drawdown and check the longest recovery period before increasing risk.
fxrobustix posted:With almost 7,000 trades there is enough data to analyse the system properly, but 65.95% drawdown is very high compared with the gain.
I would split the results by symbol, long and short direction, session and year. This can show whether one part of the system creates most of the profit while another part creates most of the drawdown.
Because it trades frequently, commission and spread stress tests are also important. I would compare balance drawdown with equity drawdown and check the longest recovery period before increasing risk.
@fxrobustix — appreciate the detailed feedback, here's the real breakdown pulled straight from the account:
1. Long/Short split: Longs 65% win rate (2,533/3,867), Shorts 63% win rate (1,971/3,084) — win rate is nearly identical both directions, so the edge isn't coming from one side only.2. Symbols traded: EURUSD (bulk of volume), XAUUSD, AUDUSD, USDCHF, BTCUSD.3. Commission/spread: $0.00 commissions — this runs on a zero-spread, zero-commission arrangement tied to the deposit size. Being upfront: results won't fully replicate on a standard retail spread+commission account.4. Drawdown origin: The 65.95% max drawdown happened in a 2-day window in July, after which we revised the algo and risk settings.5. Balance/Equity picture: Balance is $30,152.51, equity $32,152.51. Equity peaked at $39,391.38 on Aug 19, so we're currently still ~18.4% below that high — technically still inside the recovery, not fully recovered yet.6. Deposits/withdrawals: $12,000 deposited total against $23,454 already withdrawn — the account has paid out nearly 2x the original deposit.7. Post-change performance: August alone shows +111.04% gain across 4,147 trades — higher frequency, smaller risk per trade, not a repeat of the July drawdown conditions.8. Edge quality: Profit Factor 1.81, Expectancy $6.27/trade, avg win $21.65 vs avg loss -$22.03 — a high-frequency, high-win-rate system, not a high R:R one.

Soul_Shadow posted:fxrobustix posted:With almost 7,000 trades there is enough data to analyse the system properly, but 65.95% drawdown is very high compared with the gain.
I would split the results by symbol, long and short direction, session and year. This can show whether one part of the system creates most of the profit while another part creates most of the drawdown.
Because it trades frequently, commission and spread stress tests are also important. I would compare balance drawdown with equity drawdown and check the longest recovery period before increasing risk.
@fxrobustix — appreciate the detailed feedback, here's the real breakdown pulled straight from the account:
1. Long/Short split: Longs 65% win rate (2,533/3,867), Shorts 63% win rate (1,971/3,084) — win rate is nearly identical both directions, so the edge isn't coming from one side only.2. Symbols traded: EURUSD (bulk of volume), XAUUSD, AUDUSD, USDCHF, BTCUSD.3. Commission/spread: $0.00 commissions — this runs on a zero-spread, zero-commission arrangement tied to the deposit size. Being upfront: results won't fully replicate on a standard retail spread+commission account.4. Drawdown origin: The 65.95% max drawdown happened in a 2-day window in July, after which we revised the algo and risk settings.5. Balance/Equity picture: Balance is $30,152.51, equity $32,152.51. Equity peaked at $39,391.38 on Aug 19, so we're currently still ~18.4% below that high — technically still inside the recovery, not fully recovered yet.6. Deposits/withdrawals: $12,000 deposited total against $23,454 already withdrawn — the account has paid out nearly 2x the original deposit.7. Post-change performance: August alone shows +111.04% gain across 4,147 trades — higher frequency, smaller risk per trade, not a repeat of the July drawdown conditions.8. Edge quality: Profit Factor 1.81, Expectancy $6.27/trade, avg win $21.65 vs avg loss -$22.03 — a high-frequency, high-win-rate system, not a high R:R one.
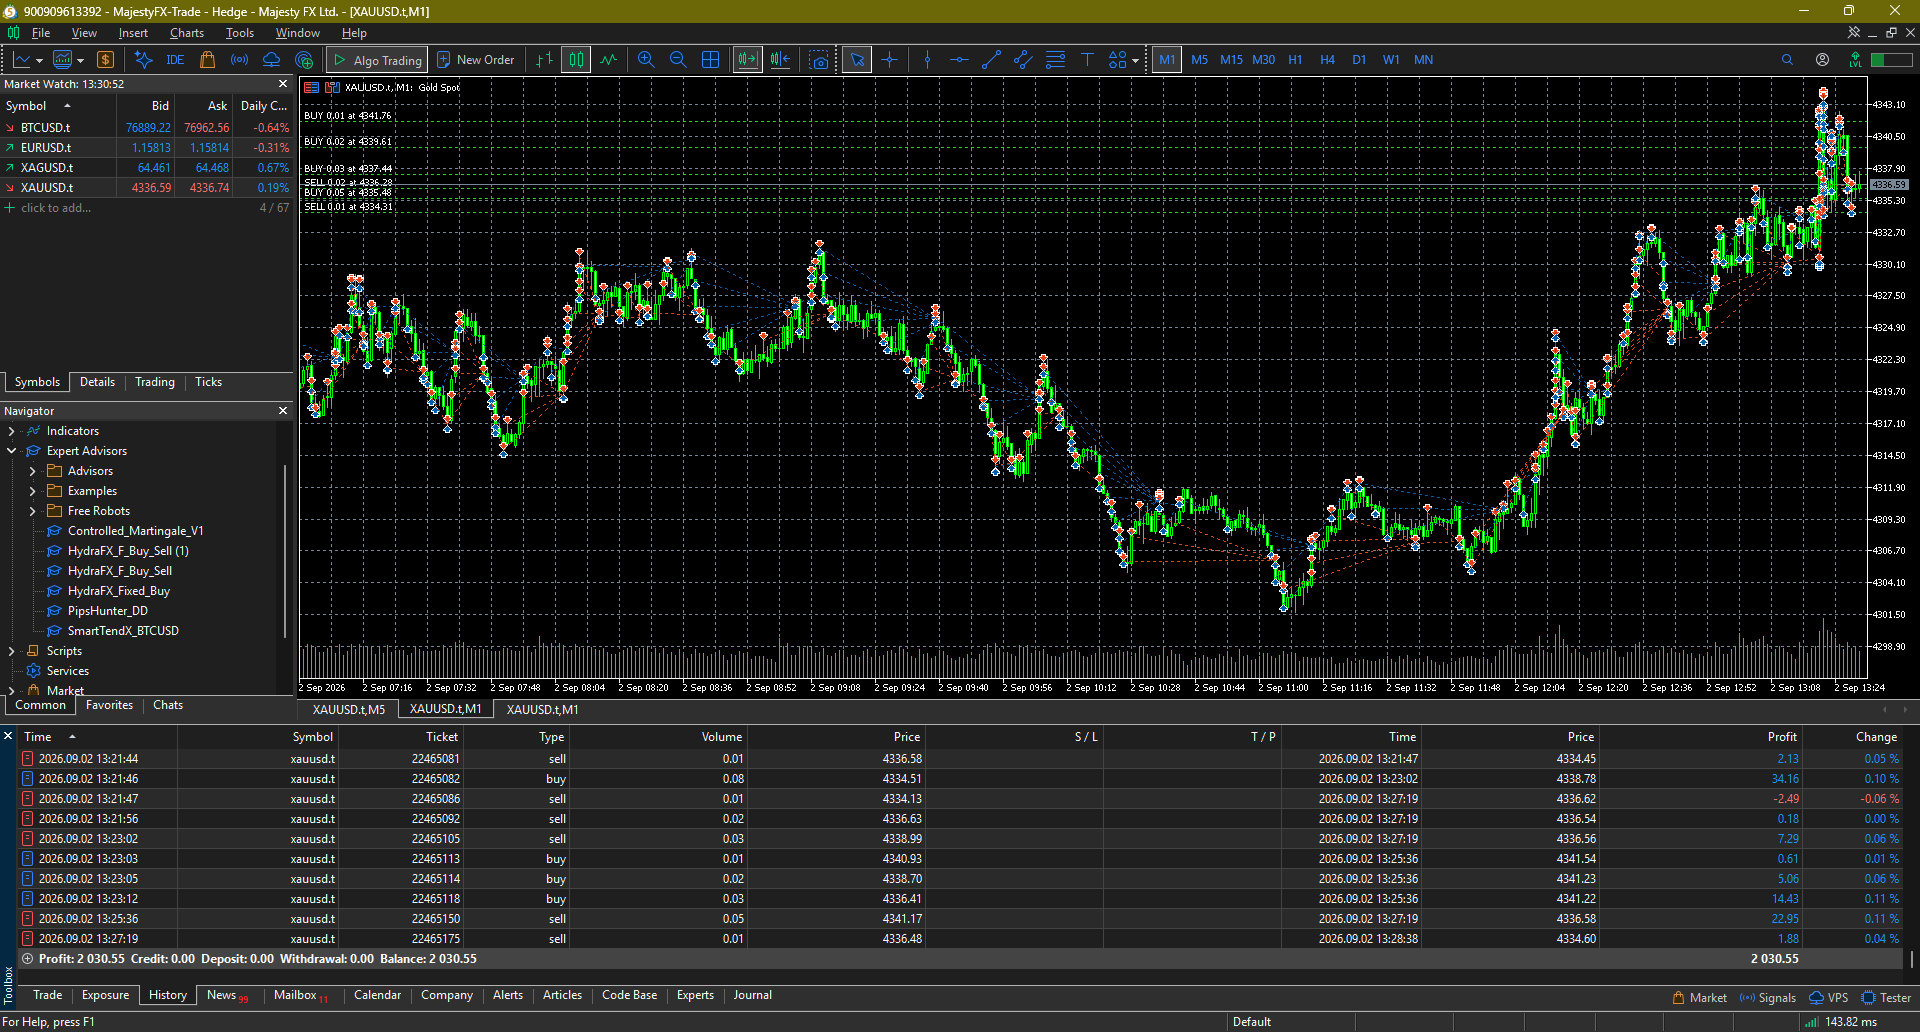
It appears to be a martingale EA, lot size increasing as it goes against the original trade.
ZKFXtrader posted:Soul_Shadow posted:fxrobustix posted:With almost 7,000 trades there is enough data to analyse the system properly, but 65.95% drawdown is very high compared with the gain.
I would split the results by symbol, long and short direction, session and year. This can show whether one part of the system creates most of the profit while another part creates most of the drawdown.
Because it trades frequently, commission and spread stress tests are also important. I would compare balance drawdown with equity drawdown and check the longest recovery period before increasing risk.
@fxrobustix — appreciate the detailed feedback, here's the real breakdown pulled straight from the account:
1. Long/Short split: Longs 65% win rate (2,533/3,867), Shorts 63% win rate (1,971/3,084) — win rate is nearly identical both directions, so the edge isn't coming from one side only.2. Symbols traded: EURUSD (bulk of volume), XAUUSD, AUDUSD, USDCHF, BTCUSD.3. Commission/spread: $0.00 commissions — this runs on a zero-spread, zero-commission arrangement tied to the deposit size. Being upfront: results won't fully replicate on a standard retail spread+commission account.4. Drawdown origin: The 65.95% max drawdown happened in a 2-day window in July, after which we revised the algo and risk settings.5. Balance/Equity picture: Balance is $30,152.51, equity $32,152.51. Equity peaked at $39,391.38 on Aug 19, so we're currently still ~18.4% below that high — technically still inside the recovery, not fully recovered yet.6. Deposits/withdrawals: $12,000 deposited total against $23,454 already withdrawn — the account has paid out nearly 2x the original deposit.7. Post-change performance: August alone shows +111.04% gain across 4,147 trades — higher frequency, smaller risk per trade, not a repeat of the July drawdown conditions.8. Edge quality: Profit Factor 1.81, Expectancy $6.27/trade, avg win $21.65 vs avg loss -$22.03 — a high-frequency, high-win-rate system, not a high R:R one.
It appears to be a martingale EA, lot size increasing as it goes against the original trade.
Yes it's a martingale EA, with a proper risk-management layer built around it, not a blind lot-doubling grid.