




A Quantitative Perspective Behind Drawdown, FOMO, and Predictive Trading

Trading failures are often attributed to the strategy itself, yet quantitative data reveals a different picture: most losses originate from how traders react to drawdowns and how they fall into FOMO. These are psychological phenomena, but they leave measurable traces in trading data from equity curve fluctuations to recurring entry patterns.
Internal analysis from the WeMasterTrade community, combined with real behavioral observations on live accounts and Myfxbook performance profiles, shows that these two loss cycles are far from random. They follow structure, logic, and, crucially, they can be anticipated.
Drawdown: A Downfall Shaped by the Trader’s Response
Data from 1,000 prop firm traders highlights a simple fact: drawdown does not kill an account; the trader’s reaction to drawdown does.
When a drawdown appears, most traders resort to decisions that work against themselves. Many underestimate the natural drawdown range of their system and panic when equity drops even slightly. Others switch strategies in the middle of a losing cycle, disrupting the statistical expectation they were originally operating under. The most severe response is increasing position size to “recover,” which pushes the account into risk escalation - a stage where each subsequent decision deepens the drawdown until the prop firm’s limit is hit.
A peak-to-trough drawdown is not a signal that a strategy has failed. It is a mathematical by-product of capital growth: when the reference point shifts upward, the natural scale of retracement also expands. It is the incorrect reaction during this phase that turns normal volatility into a severe setback.
Probability Simulation: When Data Confirms Drawdown as an Inevitable Component 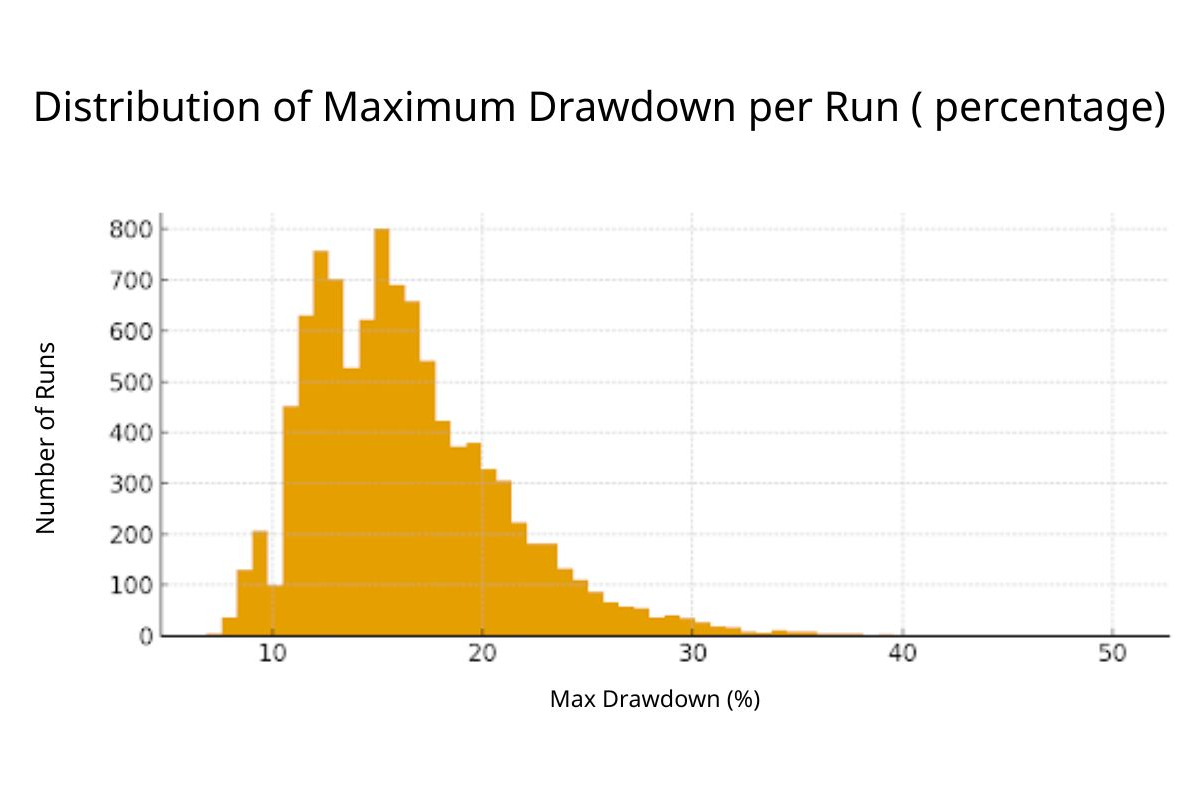
Monte Carlo simulations of 10,000 trading sequences with realistic parameters - a 40% win rate, a 1:2 risk-to-reward ratio, and a 1% risk per trade - reveal that more than 95% of sequences experience drawdowns greater than 10%. The median maximum drawdown is around 15.7%, and a drop to 90% equity occurs in only 12.6% of scenarios.
These results show clearly that drawdown is an inherent part of any strategy with fluctuating returns. It is not necessarily a sign of strategic deterioration.
Problems arise when a strategy’s natural drawdown exceeds the risk limits imposed by prop firms. In such cases, even a strategy with a genuine edge may be disqualified, not due to inefficiency, but due to a mismatch between its risk structure and the constraints of the challenge environment.
This is why the priority is not to optimize the strategy itself, but to adjust the risk per trade so that the drawdown falls within an acceptable safety range. Data from the WeMasterTrade community shows that reducing risk from 0.75% to 0.25% per trade significantly decreases the likelihood of violating challenge limits and increases the probability of success.
FOMO and Its Impact on Entry Timing, Position Sizing, and Risk Structure
When analyzing more than 10,000 trades from traders who exhibited clear FOMO-driven behavior, a consistent pattern emerged. Many entries occurred two to three candles late, often during strong market acceleration. Position sizes tended to spike in overbought or oversold zones, indicating momentum-chasing rather than systematic execution. Emotional cycles also influenced trading frequency; after three consecutive wins, the number of trades increased by 40–60%. After a major loss, 58% of traders re-entered the market within three minutes, a reaction driven more by dopamine than by discipline.
Stop-loss levels also widened considerably, often by 25–80%, distorting the original risk-to-reward structure. When consistency is lost, the edge of the strategy disappears. These issues arise not because the market is too challenging, but because behavior is no longer aligned with the system.
Drawdown Cycles and FOMO Cycles: Two Predictable Patterns 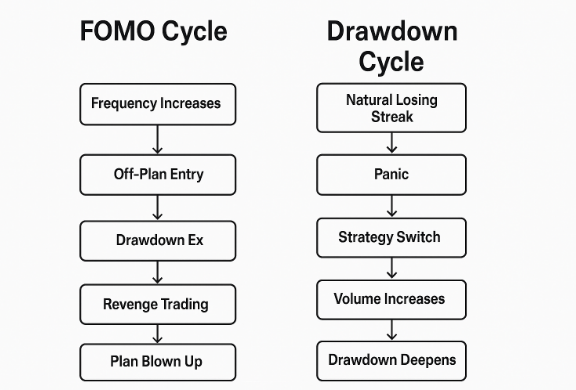
Every trader has a unique behavioral profile, and their loss cycles tend to repeat according to identifiable patterns. Drawdown cycles repeat in line with probability, while FOMO cycles repeat due to emotional triggers. These two forces interact, creating characteristic equity decline curves. When data is tracked over time, both cycles can be recognized before they activate, which is why behavioral data has become a crucial component of modern trading insights.
Quantifying Emotion: When Psychology Becomes a Measurable Variable
Behavioral analysis from WeMasterTrade suggests that traders do not need to replace their strategies; rather, they need to observe their own behavior more clearly. Metrics such as the Impulse Index, Late Entry Ratio, Momentum-Chasing Score, stop-loss discipline, and stability during drawdown allow traders to identify precisely when they begin to drift away from their system.
Once emotions are expressed in numerical form, psychological blind spots diminish. Decisions become more stable. FOMO weakens. Drawdown cycles no longer spiral beyond control. A simple pre-trade checklist, when applied correctly, has shown the ability to reduce emotionally driven trades by 40–70%.
One of the most important insights revealed by data is that missing a trade can itself be a strategy. Avoiding unnecessary entries protects the account from avoidable drawdowns, and market opportunities always return.
Conclusion
Data does not eliminate emotion, but it transforms emotion into something observable and manageable. When traders understand the statistical nature of drawdowns, they stop abandoning their strategies during normal fluctuations. When they recognize that FOMO operates through recurring emotional patterns, the quality of their entries improves. And when behavior is quantified, decision-making becomes far more consistent.
In the prop firm environment, where risk limits are strictly enforced, the real advantage does not come from finding a perfect strategy but from being able to operate a valid one without self-sabotage. Data enables traders to do exactly that.
Ultimately, trading outcomes are shaped not by the market but by the level of discipline a trader can sustain in the face of the inevitable probabilities that define the game.





