
 (1)-25620261315.jpg)





Today Technical Analysis: Gold Wipes Out Weekly Gains, Tests $5,100 Key Level


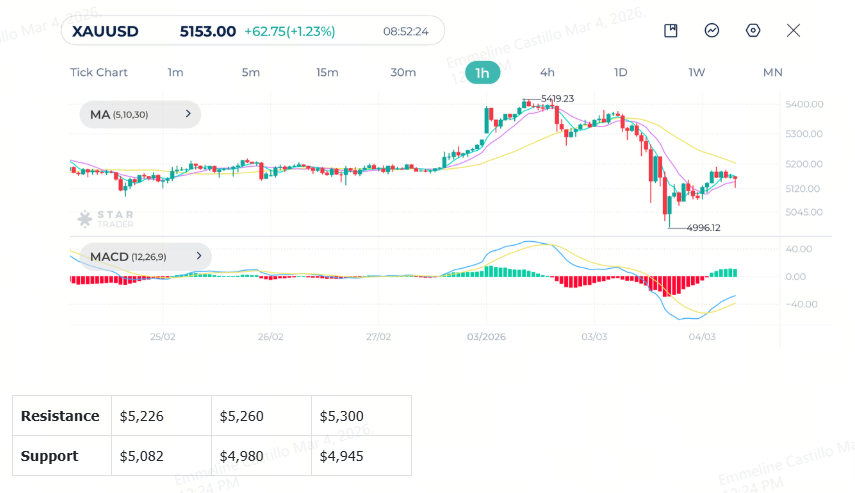
Gold Technical Analysis
Gold has transitioned from an impulsive bullish phase into a broader corrective structure. After peaking at $5420, price experienced a sharp selloff below $5,000 marking a significant swing low. That decline broke short-term bullish structure and shifted momentum bearish.
Although there has been a minor recovery, price remains below the 30-period moving average, which is now flattening to slightly downward. The shorter moving averages are compressing, suggesting consolidation within a broader corrective phase.
MACD confirms the momentum transition. MACD line is attempting to cross above the signal line. However, both remain below the zero line, indicating that this is still a corrective bounce within a larger bearish swing.
Key resistance lies at $5,200–$5,250, followed by $5,300–$5,350. A break below $5,000 would confirm continuation toward deeper retracement levels. A sustained break above $5,300 would be required to reestablish a bullish structure.
Gold 1H Chart
Dow Jones Technical Analysis
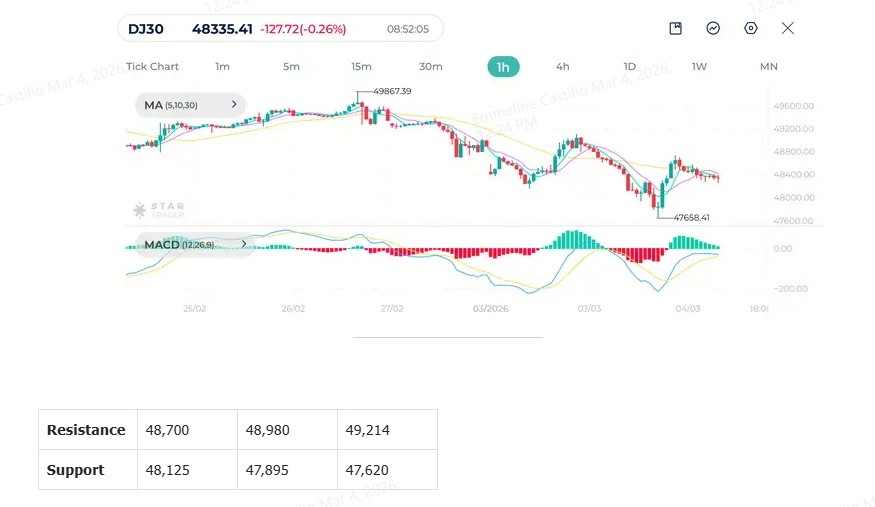
Dow Jones remains in a clear short-term downtrend. The market formed a series of lower highs and lower lows. The rebound that followed appears corrective and has failed to reclaim prior structure highs, reinforcing bearish control.
The moving averages are bearishly aligned. MA(5) is below the MA(10) and both are positioned beneath MA(30), which is sloping downward, acting as dynamic resistance.
MACD reflects weakening upside momentum after the recent bounce. The MACD line is flattening near the signal line, suggesting loss of bullish momentum and increasing risk of another bearish crossover.
A breakdown below 47,658 would likely extend the bearish leg toward 47,200. Only a sustained reclaim above 48,800 would neutralize the immediate bearish bias.
Dow Jones 1H Chart
USDJPY Technical Analysis
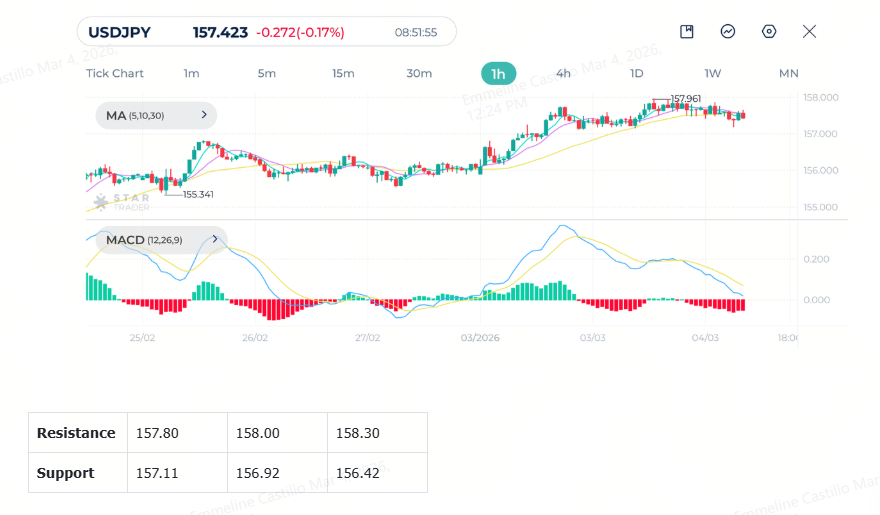
USDJPY is showing signs of topping after an extended bullish move as seen on the 1H chart. While the broader trend remains upward, recent price action indicates momentum exhaustion and short-term distribution near the highs.
The moving averages show early signs of weakening bullish alignment.
MACD clearly reflects momentum deterioration. After peaking strongly during the rally, the MACD line crossed below the signal line. Both lines are trending downward toward the zero line, reinforcing short-term corrective pressure.
Immediate support lies at 157.00, followed by 156.50 and 156.00. A break below 156.00 would confirm a deeper retracement toward the 30-period moving average. A sustained breakout above 158.00 would invalidate the corrective outlook and resume bullish continuation.
USDJPY 1H Chart
Risk Disclaimer: This material is provided for informational purposes only and does not constitute a recommendation or investment advice. Trading financial instruments on margin involves substantial risk and may not be appropriate for all investors.