




DXY Double-Top Breakdown Faces a Critical U.S. Labor-Market Test

Summary
- DXY has confirmed a double-top breakdown below 100.35, shifting the daily structure into a bearish regime.
- Price has reached the first downside target near 100.00, increasing the probability of a corrective rebound before further weakness.
- The 4-hour recovery remains counter-trend while the index trades below 100.35 and especially below 100.85.
- Strong U.S. labor and services data could trigger a dollar squeeze, while weaker employment evidence would support a move toward 99.56 and 99.07.
Technical Thesis
The U.S. Dollar Index has shifted into a medium-term bearish regime after confirming a double-top breakdown below 100.35 and violating the rising trendline that had supported the advance from the May low. Daily momentum and expanding volatility support the bearish signal, although price has already reached the first downside objective near 100.00 and remains above the 200-period WMA around 99.48.
The 4-hour chart shows a corrective rebound rather than a confirmed reversal. DXY remains below the broken neckline at 100.35 and the more important resistance level at 100.85. This week’s U.S. labor and services data will determine whether the rebound develops into a failed breakdown or whether selling resumes toward the 99.56–99.48 support cluster and the double-top projection near 99.07.
Multi-Timeframe Analysis
Daily Chart: Double-Top Breakdown Changes the Strategic Bias
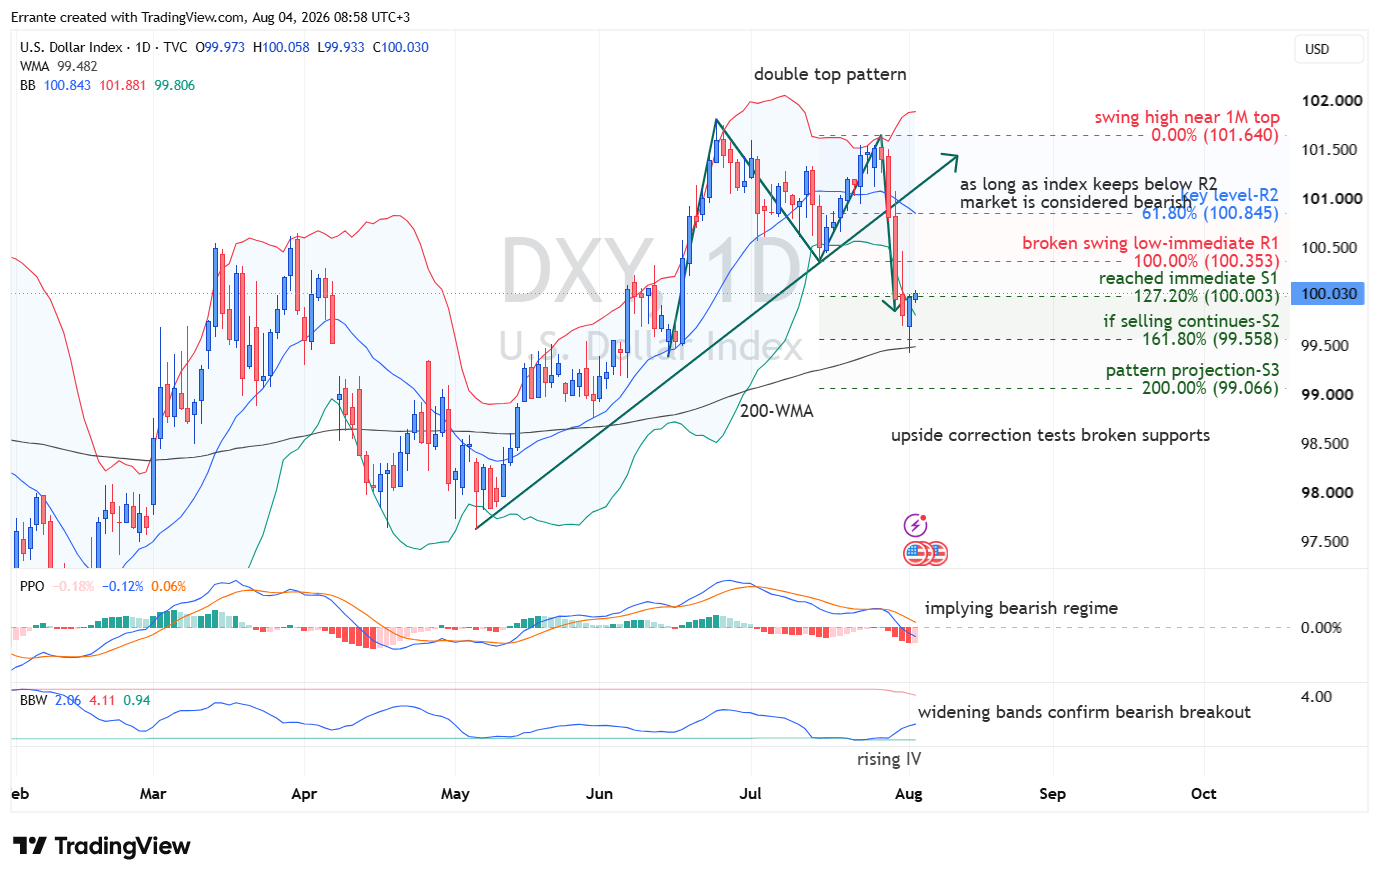
The daily chart shows a confirmed double-top structure around 101.64. The pattern became active when price broke beneath the intervening swing low and neckline near 100.35. That breakdown also violated the rising trendline from the May low, providing two independent forms of structural confirmation.
The polarity of 100.35 has therefore changed. It previously acted as support but should now be treated as immediate resistance. As long as DXY remains below that level, rebounds represent tests of broken support rather than evidence of a restored uptrend.
The broader bearish threshold is 100.85. This level combines the 61.8% retracement reference, the daily Bollinger basis and an important former support area. A recovery above 100.35 would improve the short-term picture, but the medium-term bearish regime would remain intact unless price can sustain a move above 100.85.
The index has already reached the first Fibonacci extension near 100.00. Below this area, the next target is 99.56, followed by the 200-period WMA around 99.48. This support cluster is strategically important because the index remains above its longer-term moving average despite the recent bearish break.
The full measured objective of the double top is approximately 99.07. A move toward that target becomes more likely if price closes decisively below the 200-period WMA. Conversely, a recovery above 101.64 would invalidate the pattern itself.
4-Hour Chart: Corrective Recovery Tests Broken Support
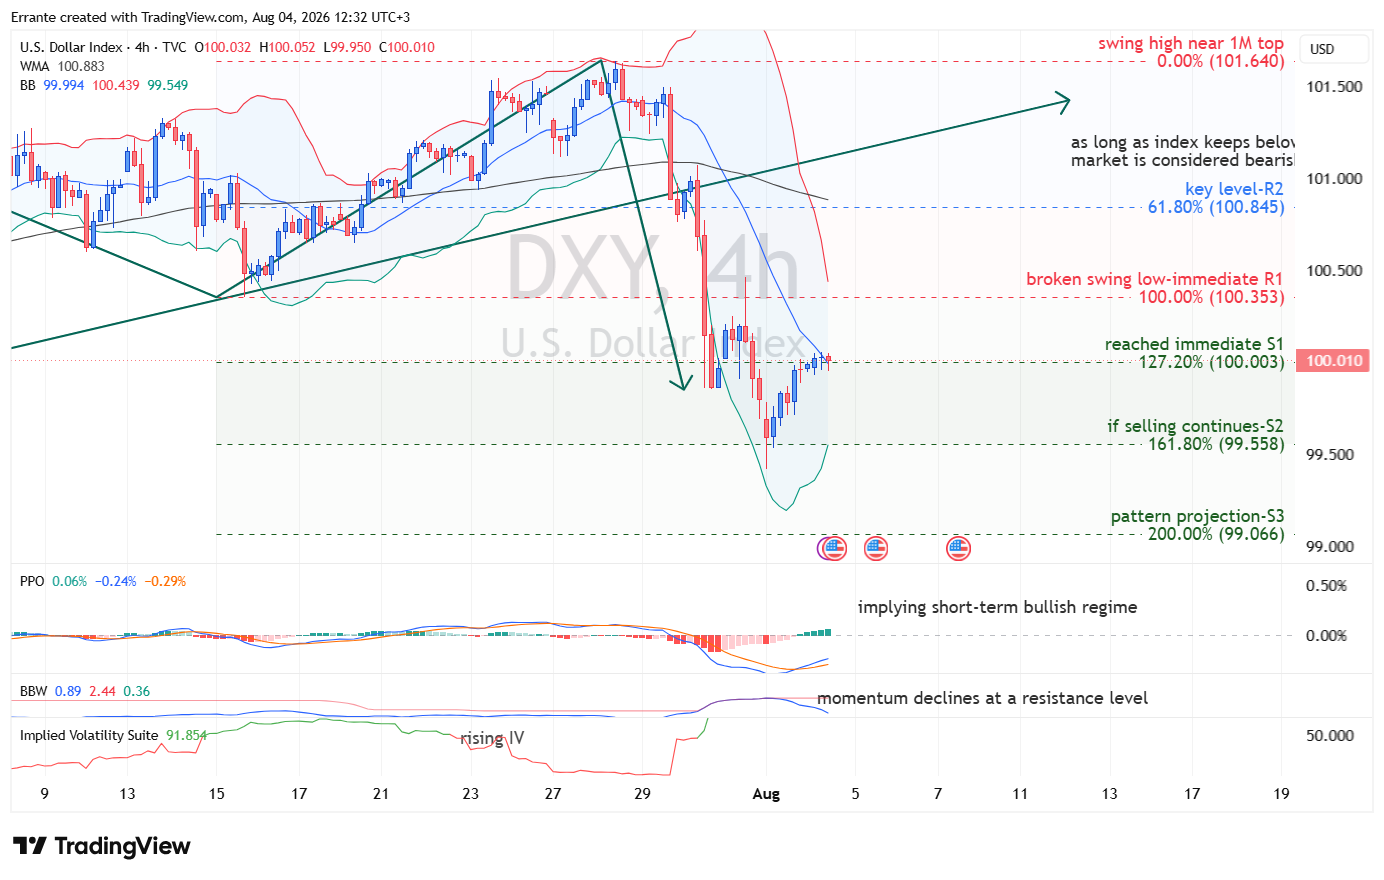
The 4-hour chart shows a rebound from the lower Bollinger Band after the sharp decline from 101.60. The recovery has lifted price back toward the Bollinger basis near 100.00, while the PPO histogram has turned positive. This indicates that immediate downside momentum has moderated.
However, the broader 4-hour momentum structure remains below the zero line, and price continues to trade well beneath the 100-period WMA near 100.88. The rebound should therefore be classified as a short-term bullish correction inside a larger bearish regime.
The first decision level is 100.35. A rejection below this former swing low would confirm that sellers are defending the breakdown and would increase the probability of renewed pressure toward 99.56.
The more important decision zone extends from approximately 100.44, the upper 4-hour Bollinger Band, to 100.85. A sustained 4-hour close above 100.85 would weaken the bearish structure and indicate that the index is reclaiming former support. Until that occurs, the path of least resistance remains lower despite the current rebound.
Momentum and Market Conditions
Daily momentum confirms the bearish regime. The PPO line and signal line have moved below zero, while the histogram remains negative. This indicates that the decline represents more than a brief intraday reaction and has affected the underlying medium-term momentum structure.
Bollinger Band Width is rising on the daily chart after a period of compression. Volatility expansion in the direction of a confirmed support break strengthens the quality of the bearish signal. Rising implied volatility further suggests that the market is assigning greater probability to larger dollar moves.
The 4-hour picture is more nuanced. PPO momentum has begun to recover, but the improvement is occurring below the zero line. This normally describes a counter-trend rebound rather than an established bullish phase. Bollinger Band Width has also moderated after the initial volatility shock, consistent with price stabilizing before the next directional decision.
Because DXY does not have centralized trading volume, participation should be evaluated through volatility, Treasury yields, breadth across major dollar pairs and the quality of closes around the identified levels. A bearish move supported by falling EUR/USD, GBP/USD and AUD/USD, together with widening DXY bands, would carry greater credibility than an isolated intraday break.
Key Levels to Watch
Resistance
100.35 – Broken swing low, double-top neckline and immediate resistance.100.44 – Upper 4-hour Bollinger Band and near-term recovery barrier.100.85 – Primary bearish-regime threshold and key recovery confirmation level.101.64 – Double-top high and complete pattern-invalidation level.
Support
100.00 – First downside projection and current short-term pivot.99.56 – Second Fibonacci extension and next continuation target.99.48 – 200-period WMA and major dynamic support.99.07 – Double-top measured objective and deeper structural target.
Scenario Outlook
Bullish Scenario
A sustained recovery above 100.35 would indicate that DXY is reclaiming the broken neckline and could extend the correction toward 100.44 and 100.85.
The macro trigger would likely require stronger-than-expected labor demand, resilient services activity and continued price pressure. Job openings holding near or above recent levels, firm services employment and prices, and a payroll rebound accompanied by stable or stronger wage growth would support higher U.S. yields and increase the probability of a move above 100.85.
A confirmed 4-hour close above 100.85 would weaken the bearish breakdown and reopen 101.64. The double-top pattern would not be fully invalidated unless price moves above the prior peaks.
Neutral Scenario
DXY may consolidate between the 99.56–99.48 support cluster and resistance at 100.35 or 100.85 if this week’s data produce conflicting signals.
For example, strong activity data combined with softer labor demand could leave markets divided between U.S. growth resilience and reduced Federal Reserve tightening risk. Under this scenario, the index would remain technically bearish but without sufficient momentum to reach the full pattern target.
The 100.00 area would continue to operate as the short-term pivot, with traders waiting for a confirmed break from the broader range.
Bearish Scenario
A failure below 100.35 followed by a break beneath 100.00 would restore downside momentum. The first target would be 99.56, with the nearby 200-period WMA at 99.48 providing the main test of the longer-term structure.
The bearish macro catalyst would be evidence that the June employment slowdown is becoming persistent. Job openings materially below expectations, weak ADP employment, softer services hiring or another subdued payroll report would reduce the dollar’s interest-rate support and reinforce the technical breakdown.
A daily close below 99.48 would expose the measured double-top target near 99.07 and confirm a more substantial deterioration in the dollar’s medium-term trend.
Trading Considerations
Bearish traders may prefer to wait for either a rejection from 100.35–100.85 or a confirmed break below 100.00 rather than chase the index after its initial decline. The current position near the first downside target creates an elevated risk of a corrective rebound.
A rejection from 100.35 would offer the earliest continuation signal. A failure near 100.85 would provide stronger evidence that the breakdown remains valid. The primary downside objectives would be 99.56, 99.48 and 99.07.
Bullish traders require confirmation rather than merely an oversold rebound. A move above 100.35 would improve the short-term structure, but a sustained 4-hour close above 100.85 would provide the more credible reversal signal.
Event risk is unusually concentrated this week. Position size and invalidation levels should account for the possibility of sharp repricing around JOLTS, ADP, ISM services and Friday’s employment report.
Intermarket Perspective
The fundamental picture presents a conflict between strong activity and uncertain labor demand.
Monday’s ISM manufacturing report delivered a dollar-supportive combination of stronger growth and persistent inflation pressure. The headline index reached 55.6, new orders remained firm, employment returned to expansion and prices paid stayed above 70. In isolation, this mix argues for higher Treasury yields and preserves the possibility of additional Federal Reserve tightening.
However, manufacturing represents a smaller share of the U.S. economy than services, and the labor market remains the more important constraint on the dollar this week. June payroll growth slowed to 57,000, while earlier months were revised lower. The upcoming data must therefore show that the slowdown was temporary rather than the beginning of a more persistent loss of momentum.
Tuesday’s JOLTS report is the first major test. A moderate decline in job openings would be consistent with gradual normalization, but a sharper fall would challenge the U.S. growth-premium narrative and place renewed pressure on short-term yields.
Wednesday’s ISM services report may be even more important for the Federal Reserve. The headline is expected to remain in expansion, but the prices and employment components will determine the dollar reaction. Services prices were previously elevated, so another high reading combined with resilient employment would support the case for restrictive policy.
Friday’s employment report is the decisive weekly event. Consensus expects only a modest payroll recovery, stable unemployment and continued wage growth. A material upside surprise would challenge the bearish DXY structure by restoring rate support. Another weak payroll reading, downward revisions or softer wages would align the fundamental outlook with the technical breakdown.
Oil and geopolitical developments remain an additional variable. Renewed pressure on energy prices could strengthen the dollar through higher inflation expectations and Treasury yields, although improving risk sentiment may reduce safe-haven demand. Intervention-driven yen strength also creates a direct headwind for the index and may complicate the relationship between U.S. yields and DXY.
Conclusion
The U.S. Dollar Index has confirmed a bearish structural shift after completing a double top near 101.64, breaking its neckline at 100.35 and violating the rising trendline from the May low. Negative daily PPO momentum and widening Bollinger Bands support the validity of the breakdown.
However, DXY has already reached its first downside objective near 100.00 and remains above the strategically important 99.56–99.48 support cluster. The 4-hour chart therefore favors a corrective rebound or consolidation before the next directional move.
The primary bearish threshold is 100.85. As long as DXY remains below this level, rallies should be treated as corrective and the broader risk remains directed toward 99.56, 99.48 and the double-top target near 99.07.
This week’s U.S. labor and services data provide the fundamental confirmation mechanism. Strong employment and persistent services inflation could force a recovery above 100.35 and challenge 100.85. Weak labor demand would validate the bearish pattern and increase the probability that DXY completes its measured downside objective.


US Yields Rise Despite Buybacks; Eyes on ECB Hike

GBPUSD (4H) recovery holds above 1.3550, 100-SMA remains key hurdle

US Treasury Triples Long-Term Bond Buyback Size

The euro is banking on the ECB

EBC Markets Briefing | Euro eyes more gains on mounting dollar debasement risks

Yen Hits 6-Month High, Volatility Returns After North American Holiday.

EUR/USD Holds Its Rising Channel as 1.1641 Breakout Awaits ECB and U.S. CPI