




GBP/USD: Wake me up when September ends

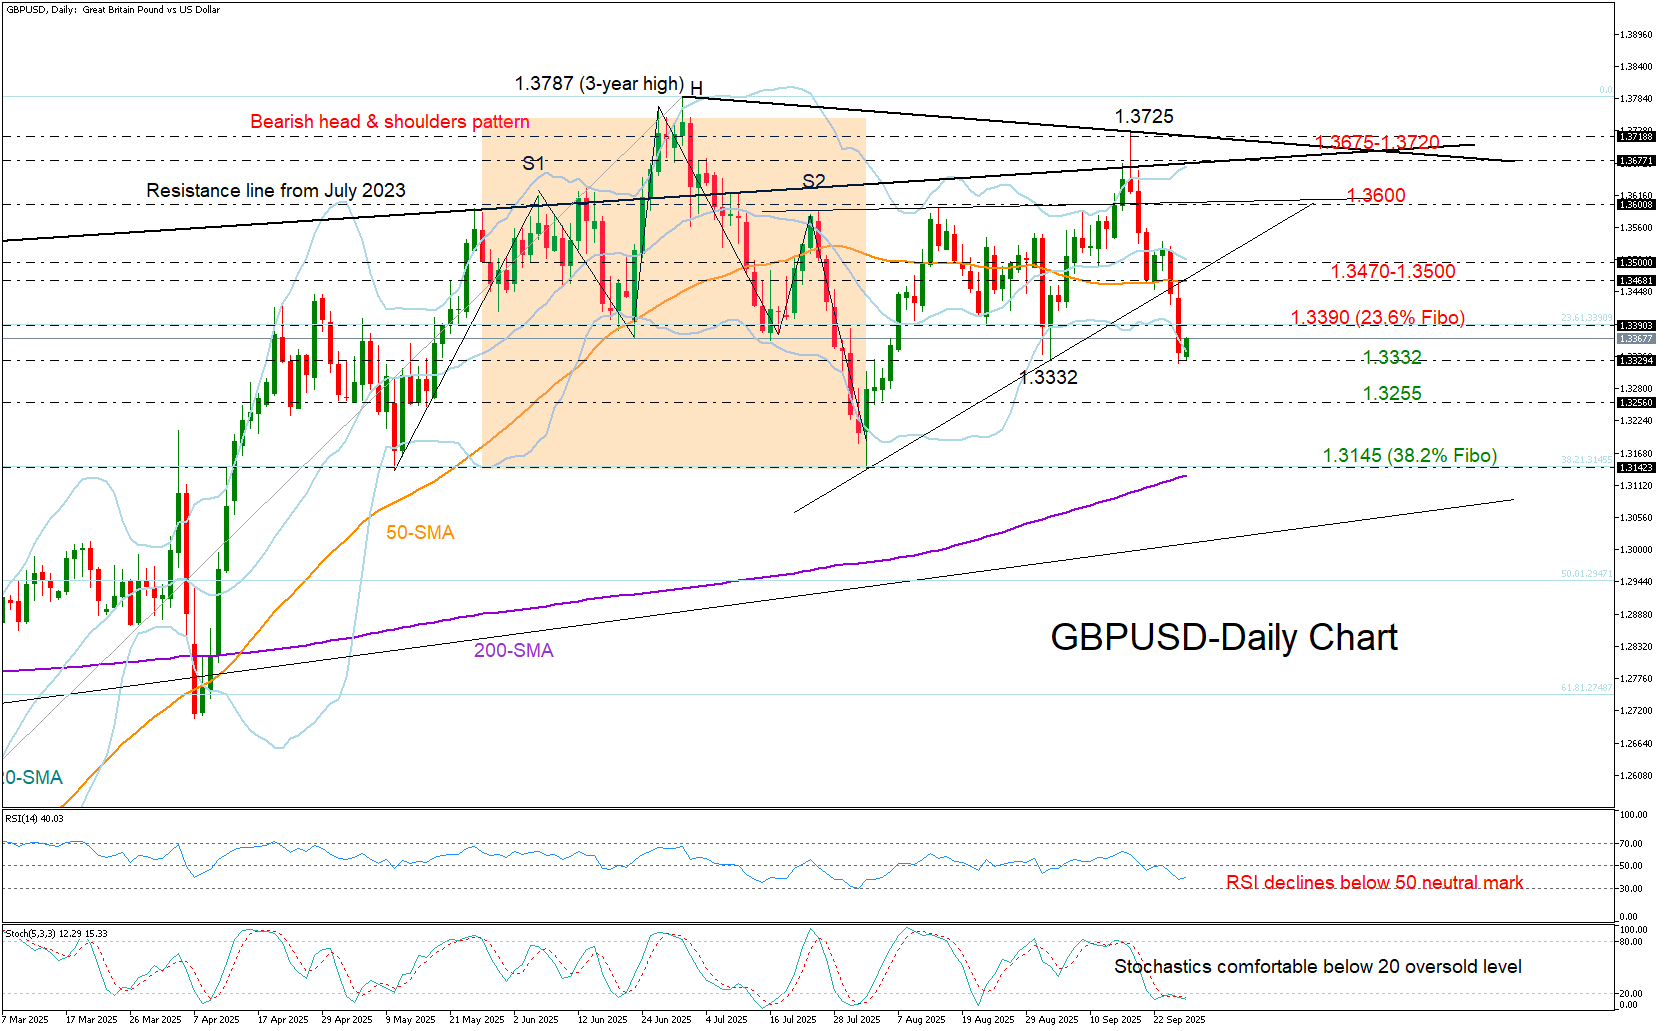
GBP/USD crashed to a seven-week low of 1.3322 on Thursday as a string of data reflected an expanding US economy, reducing the odds of an aggressive Fed rate cut.
The past two weeks have been heavy enough to push the pair into monthly losses, erasing almost 3.0% from the 1.3725 high. Yet, the price has not closed below September’s floor of 1.3332, creating speculation that the plunge could soon take a breather. The stochastic oscillator supports this narrative, fluctuating below its oversold level of 20, while the close beneath the lower Bollinger band suggests a pivot may be nearby.
If the pair fails to cross above the 23.6% Fibonacci retracement of the January–July 2025 uptrend at 1.3390, bears could retain control, driving the price towards the 1.3255 handle. Additional declines from there could expose the 38.2% Fibonacci level at 1.3145 and the 200-day simple moving average (SMA).
A potential recovery above 1.3390 could face an initial test between the 20- and 50-day SMAs, currently sitting within the 1.3470–1.3500 zone. If bulls break through that wall, they may continue towards the 1.3600 barrier. Yet, with the market structure losing momentum since the drop to 1.3139 at the start of August, the case for bullish continuation remains under scrutiny, particularly as long as the price trades below 1.3675-1.3720.
In a nutshell, GBP/USD may be near a pivotal region, though whether the pair can attract enough buyers to recover from its latest bearish wave off 1.3725 remains to be seen.


Fed Chair Speech to Set Tone for September Interest Rates Hinges

U.S. Stocks Await PCE Data & Nvidia Earnings

GBP/USD stabilizes near six-month high

Global Currencies Hold Firm as Dollar Weakness Reshapes Market Momentum | 24th August, 2026

US Threatens Unprecedented Iran Sanctions; Markets on Edge

Week Ahead: Treasury Support, Inflation Data and Fed Signals Drive Markets

US Yield Pressure & Debt Risks Take Centre Stage