UKOUSD Analysis: Is the Short-Term Bull Run Over?

UKOUSD Technical Outlook - 15 January 2026
This analysis provides a detailed view of UKOUSD price action across multiple timeframes, highlighting key levels, market shifts, and potential scenarios to watch.
UKOUSD Daily Chart Overview

The broader trend remains bearish, with prices still trading well below the declining long-term moving average. That said, a short-term recovery has been in play since mid-December 2025. Price recently pushed above the short-term moving average and is now testing the medium-term average, placing the market at a key decision point.
Momentum has improved, but the rally is showing signs of fatigue. The Stochastic Oscillator is already in overbought territory and beginning to roll over, suggesting the upside may be limited in the near term. A period of consolidation or a pullback would be healthy before any further advance.
For bullish continuation, price needs to hold above $63.50 and build acceptance higher. A clear break above $65.50 would strengthen the recovery case. Failure to defend $63.50 would indicate the broader downtrend is reasserting itself.
Key Levels
Resistance
The $65.10 - $65.50 zone is the first major resistance and carries technical significance aligned with the medium-term moving average and the most local peak where selling pressure emerged. A clean break and daily close above $65.50 would suggest buyers are regaining control and open the path toward $66.70, which represents the long-term moving average and has capped price action throughout the broader downturn. Beyond that, the $68.50 - $69.30 region marks the September to October highs and serves as major structural resistance.
Support
The $63.50 level is the most immediate and critical support, aligning with the short-term moving average and the previous breakout point from the December base. A failure to hold above $63.50 would likely trigger a move toward $61.50, which acted as a consolidation floor in late December and is the next area where buyers may attempt to stabilise the price. Below that, the $59.00 - $60.00 zone marks the mid-December lows and represents major support. A decisive break into this area would confirm that the broader bearish trend has resumed and that the recent upside move was corrective in nature.
UKOUSD 2-Hour Chart Analysis
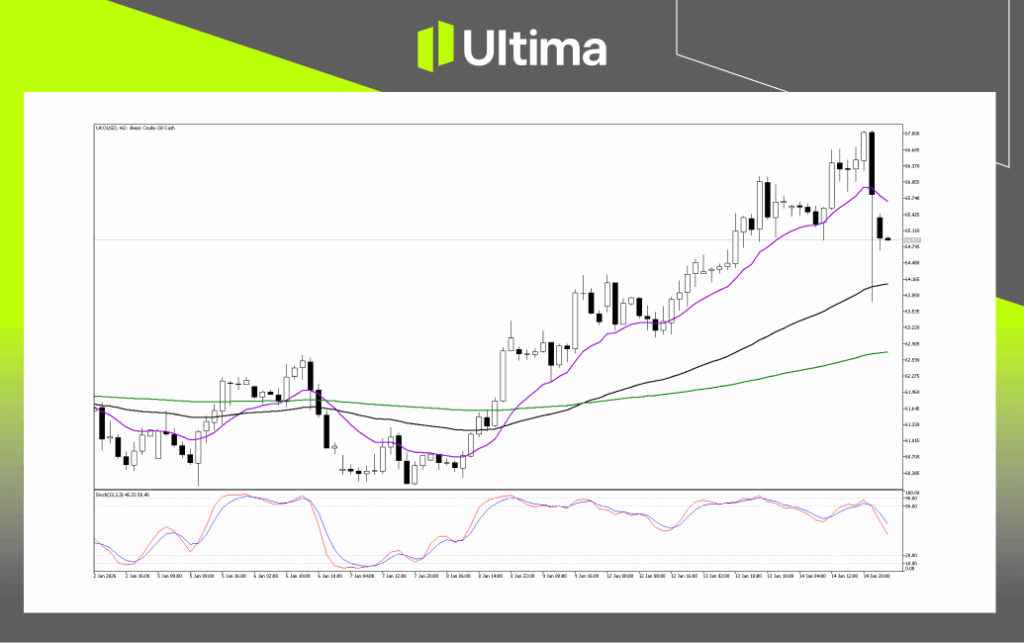
The H2 chart shows a sharp shift in market behaviour. The earlier rally that peaked near $67.00 reversed aggressively, with price slicing through the short-term moving average. This move signals a breakdown in bullish momentum and a transition back toward longer-term averages.
The selloff has been decisive, and the Stochastic remains pointed lower, confirming strong downside pressure. While price is encountering minor resistance near the medium-term average, the strength of the bearish candles suggests the correction may not be complete.
A sustained move below $64.15 would open the door toward $63.20 and potentially $62.65. If price manages to stabilise and reclaim $65.00, it may indicate the drop driven by short term positioning rather than a full trend shift. Bulls would need a close above $65.75 to regain control.
UKOUSD Pivot Indicator
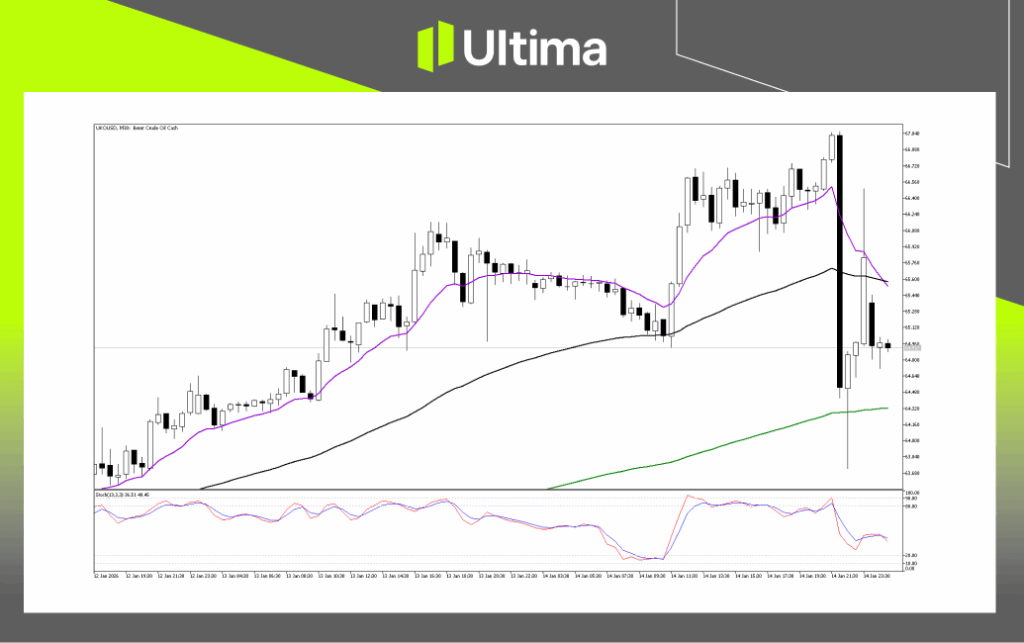
The intraday picture is neutral to bearish following a sharp volatility spike. Although buyers stepped in at lower levels, the lack of follow-through highlights weak demand. Price is currently range-bound, and direction will likely be dictated by a break of the $64.80 - $65.60 zone.
Bullish Scenario
A close above $65.60 could trigger a corrective rebound toward $66.20
Bearish Scenario
A break below $64.80 exposes $64.30 and potentially $63.50
Navigating the Forex Market with Ultima Markets
Navigating the forex markets requires clarity, discipline, and access to reliable insights. Ultima Markets is committed to providing data-driven analysis to support informed trading decisions.
Join Ultima Markets today and stay connected with us by following us on social media for the latest news, events, and product updates. Visit UM Academy and access unlimited educational trading resources to help you master the markets.
—–
Legal DocumentsTrading leveraged derivative products carries a high level of risk and may not be suitable for all investors. Leverage can magnify both gains and losses, potentially resulting in rapid and substantial capital loss. Before trading, carefully assess your investment objectives, level of experience, and risk tolerance. If you are uncertain, seek advice from a licenced financial adviser. Leveraged products are not intended for inexperienced investors who do not fully understand the risks or who are unable to bear the possibility of significant losses.
Copyright © 2025 Ultima Markets Ltd. All rights reserved.
Disclaimer
Comments, news, research, analysis, price, and all information contained in the article only serve as general information for readers and do not suggest any advice. Ultima Markets has taken reasonable measures to provide up-to-date information, but cannot guarantee accuracy, and may modify without notice. Ultima Markets will not be responsible for any loss incurred due to the application of the information provided.


The yen is strengthening before our very eyes

The Inflation Measure Keeping the Fed Cautious

US Yields Rise Despite Buybacks; Eyes on ECB Hike

Bitcoin edges lower for a 4th day, capped by the 50-week MA

GBPUSD (4H) recovery holds above 1.3550, 100-SMA remains key hurdle

Apple Stock Slips After iPhone 18 Launch as AI Growth Expectations Remain in Focus

US Treasury Triples Long-Term Bond Buyback Size