-1162026812.png)
-1162026812.png)





What Crash_100 Actually Is

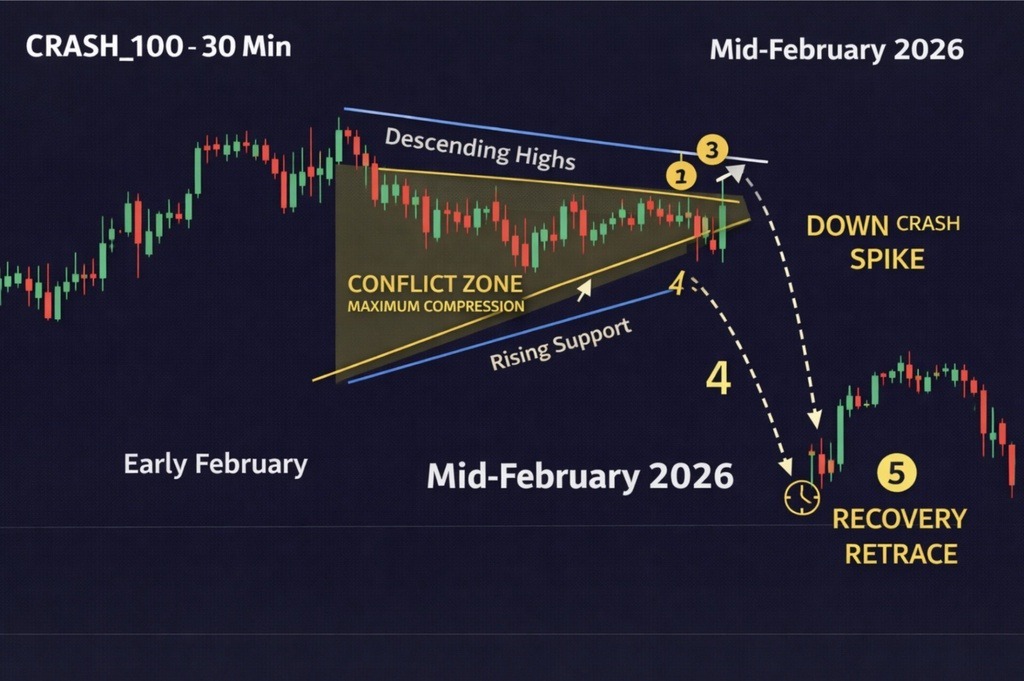
CRASH Indices — including Crash_100 — are synthetic price instruments designed to deliver sudden downward price drops (“crashes”) at regular intervals according to an algorithm, not underlying economic activity. They’re common on platforms like MetaTrader. These markets are not tied to real currencies or stocks — price movement is simulated to volatility and structural behavior, not fundamentals. Thus, the brokers don’t publish any fundamental price drivers like a FX pair would. The quotes are pure price action data, instead.
CRASH Indices are different from FX pairs as fundamental data (NFP, GDP, CPI etc.) doesn’t move them. Conversely, they behave like a random, algorithmic volatility asset.
Crash_100 Quotes — What They Look Like
CRASH Indices don’t quote like forex pairs — you see a raw index value that fluctuates rapidly in a code-driven market.
For example, Boom indices spike upwards unpredictably while Crash indices produce sudden downward “crash candles”, often within small timeframes (M1, M5, M15)
Crash_100 Analysis — How Traders See It
1) Price Action Matters. As long as fundamentals don’t apply here, the chart behavior is the ruler. A tentative step of the algorithm is as follows:
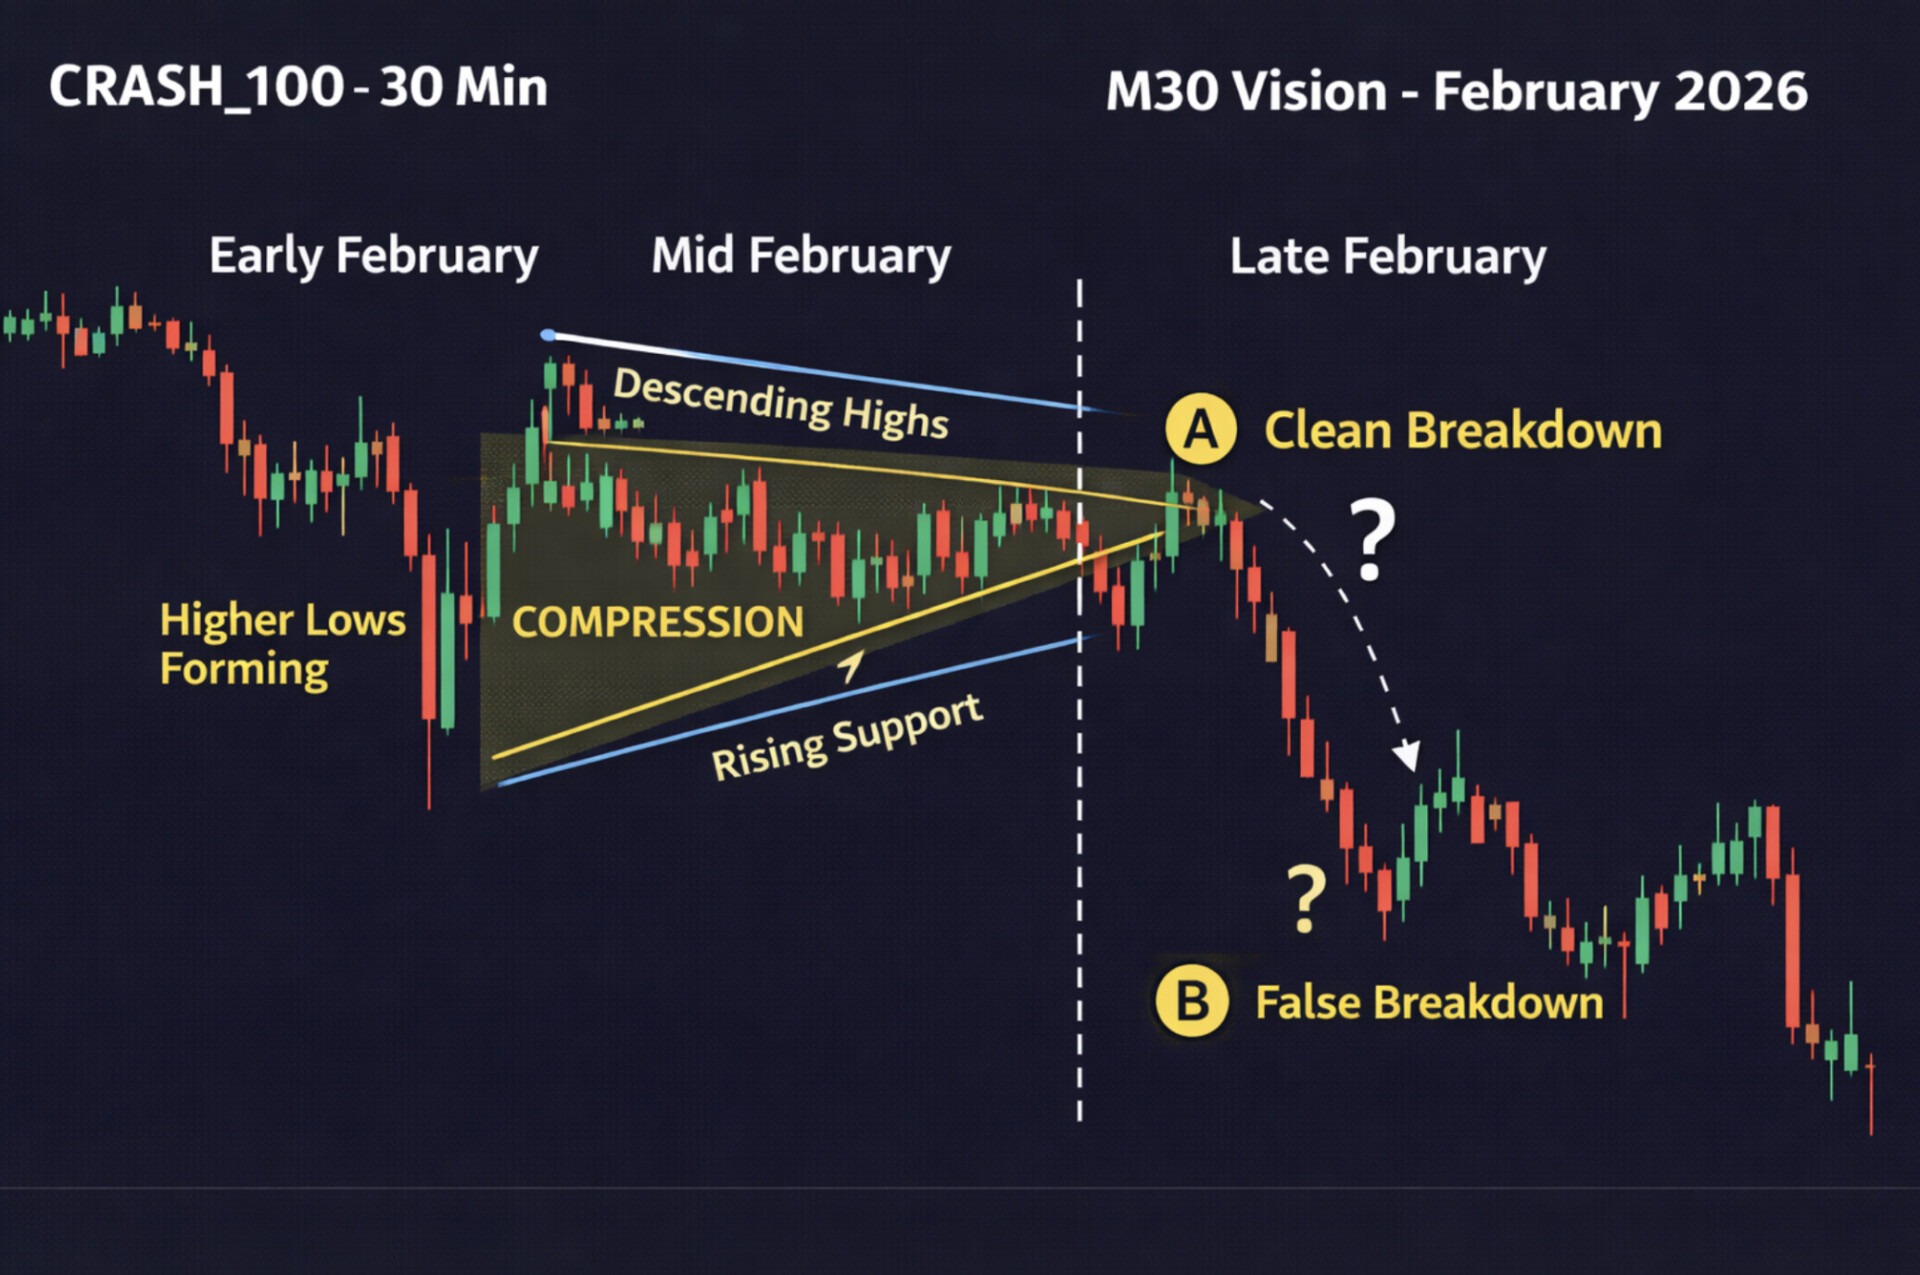
A range compression often precedes a crashA strong support leads this potential area for a crashAnd lower highs along with rising support lead to false breakout and finally cause crash2) Risk Perception. Crash indices are multi-high-risked. This is not a “buy and hold” market, for sure.
3) Time-Frame Focus. Crashes often occur sharply on short timeframes (M1, M5), so scalping setups are common.
Market Tone (Current Phase)
Crash_100 showed compression phases on higher timeframes and repeated spike behaviors in early–mid February. The market tone had a neutral-to-upward bias with strong downside spikes.
End-of-February Scenario Map
Extended Compression. We expect an explosive crash before month-end. And it gives the best waiting opportunities for spike setups. In this case, the most important rule is avoid chasing trend direction


THE US BOND YIELDS SURGE AS POLICY RISKS COLLIDE💥
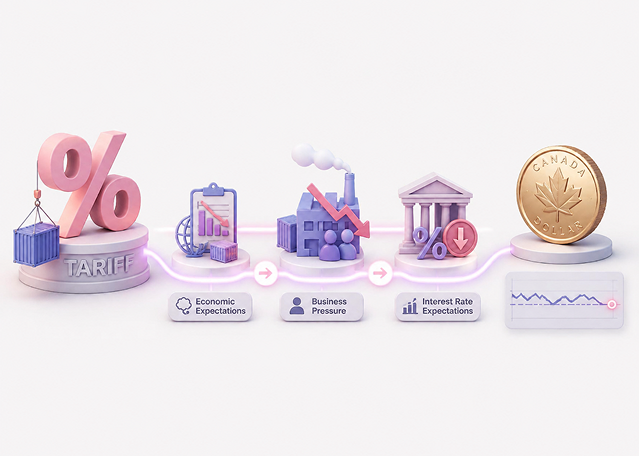
Canadian Dollar Shrugs Off Tariff Shock as Markets Focus on Bigger Risks

Week Ahead: Gold, Jobs Data and Fed Policy Shape September Markets

Today Fundamental Analysis: Oil Extends Gains for a Second Day as US-Iran Tensions Escalate

S&P 500 Retreats as Oil Surge Revives Inflation Fears

Today Technical Analysis: Gold Slides Further on US Dollar Strength, While Silver Remains Resilient

Nikkei 225 Rebounds as Investors Weigh Policy Risks