






Downbeat PCE Hinders Dollar

The US Dollar continues its decline, with increasing speculation about the Federal Reserve's dovish stance, particularly after the latest U.S. economic data released last Friday. The U.S. Personal Consumption Expenditures (PCE) price index falling short suggests a slowdown in inflation, contributing to the persistent dovish sentiment from Fed officials, which in turn has put pressure on the strength of the dollar. In the commodities market, gold prices experienced a slight gain, benefitting from the softening dollar. Conversely, oil prices saw a modest decline following Angola's exit from OPEC. These movements reflect the intricate interplay of economic data, central bank commentary, and geopolitical factors influencing currency and commodity markets.
Current rate hike bets on 31 January Fed interest rate decision:
Source: CME Fedwatch Tool
0 bps (83.5%) VS -25 bps (16.5%)
Market Movements
 DOLLAR_INDX, H4
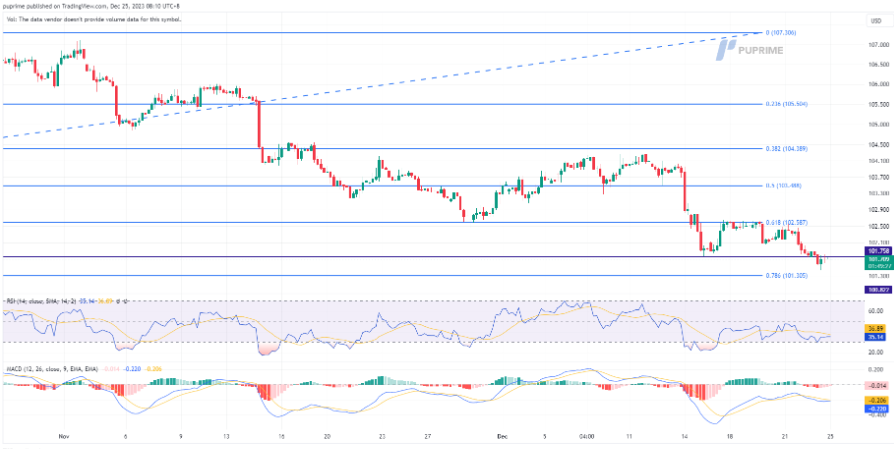
The US Dollar remains under downward pressure, reaching its lowest level since July. Recent economic data, including the U.S. Gross Domestic Product (GDP) and the U.S. Personal Consumption Expenditures (PCE) released last week, indicate a slowdown in the U.S. economy. This has heightened speculation about a dovish shift from the Federal Reserve (Fed), exerting additional pressure on the dollar's strength.
The Dollar Index is suppressed below its long-term Fibonacci Retracement level of 61.8%, suggesting the dollar remains trading in a bearish trend. The RSI flowing near the oversold zone while the MACD hovering below the zero line suggests the dollar is trading in a bearish momentum.
Resistance level: 102.60, 103.50
Support level: 101.30, 100.80
XAU/USD, H4
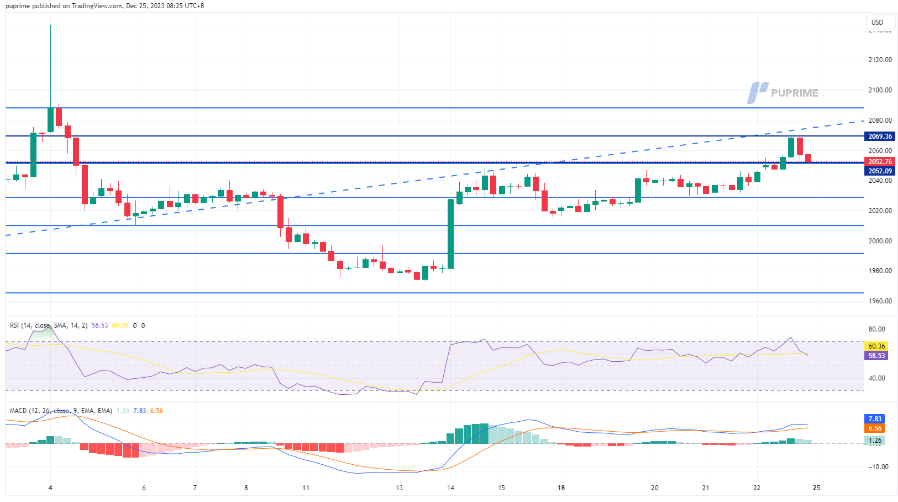
Gold prices experienced a slight increase last Friday, benefiting from the weakening strength of the U.S. dollar. Simultaneously, concerns intensified in the Middle East as Iran reportedly received new cruise missiles amid growing tensions in the region. The United States also accused Iran of a drone attack on a chemical tanker in the Indian Ocean, indicating a heightened state of tension in the area.
Gold prices are finding support at above its long-term Fibonacci Level of 23%, suggesting the bullish run remains intact. The RSI hovering closely to the overbought zone while the MACD flowing above the zero line suggests the bullish momentum remains.
Resistance level: 2069.35, 2088.10
Support level: 2028.50, 2010.00
GBP/USD,H4
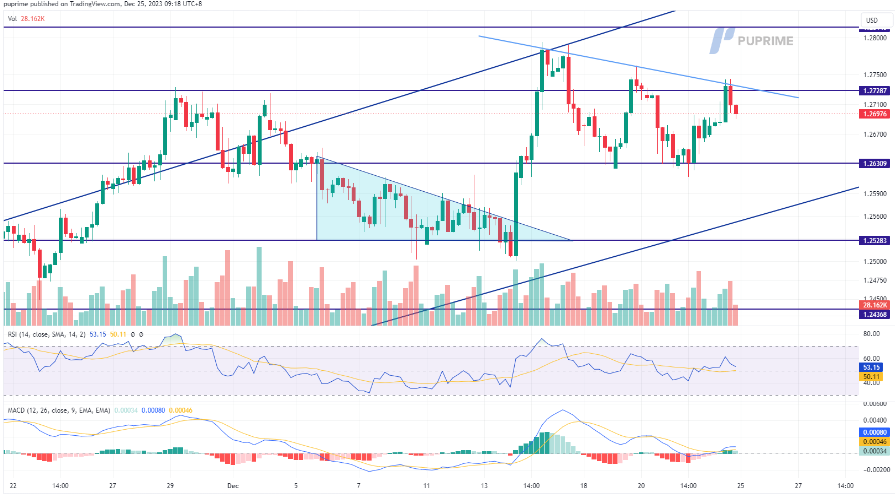
The GBP/USD pair posted marginal gains despite the ongoing weakness in the U.S. dollar, which has been attributed to lacklustre economic data. However, the United Kingdom's Gross Domestic Product (GDP) data released last Friday fell short of expectations, suggesting challenges for the country's economy. This disappointing economic performance put pressure on Sterling against its currency counterparts.
GBP/USD has formed a lower high price pattern, suggesting the pair has a bearish bias. The RSI is declining from the overbought zone while the MACD approaches the zero line from the top.
Resistance level: 1.2729, 1.2815
Support level: 1.2630, 1.2528
USD/CHF,H4
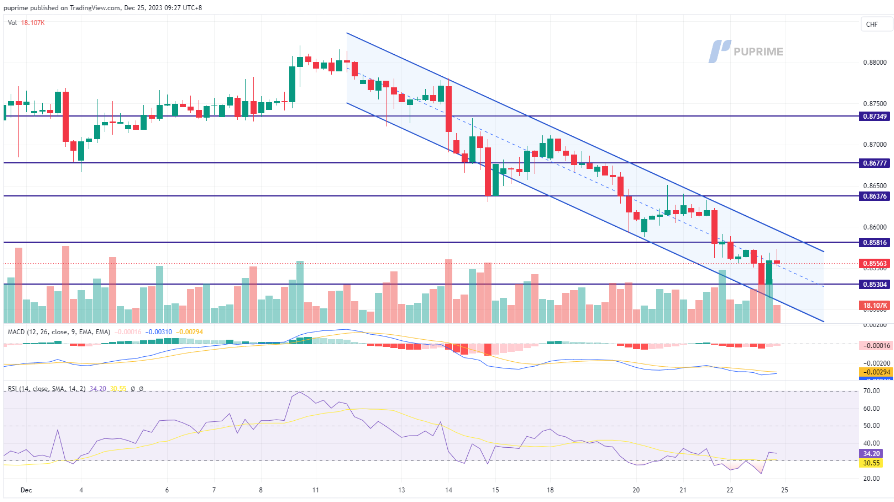
The USD/CHF pair is approaching its lowest level since 2015 as the U.S. dollar encounters headwinds. Market speculation surrounding a dovish stance from the Federal Reserve has intensified, adding pressure on the dollar. Additionally, the Swiss National Bank's decision to abandon its policy to contain the strength of the Swiss Franc has further contributed to the downward movement of the USD/CHF pair.
The USD/CHF pair is trading in a downward trajectory. The MACD has been moving lower while the RSI hovering near the oversold zone suggests that the bearish momentum is strong.
Resistance level: 0.8582, 0.8638
Support level: 0.8530, 0.8456
USD/JPY,H4
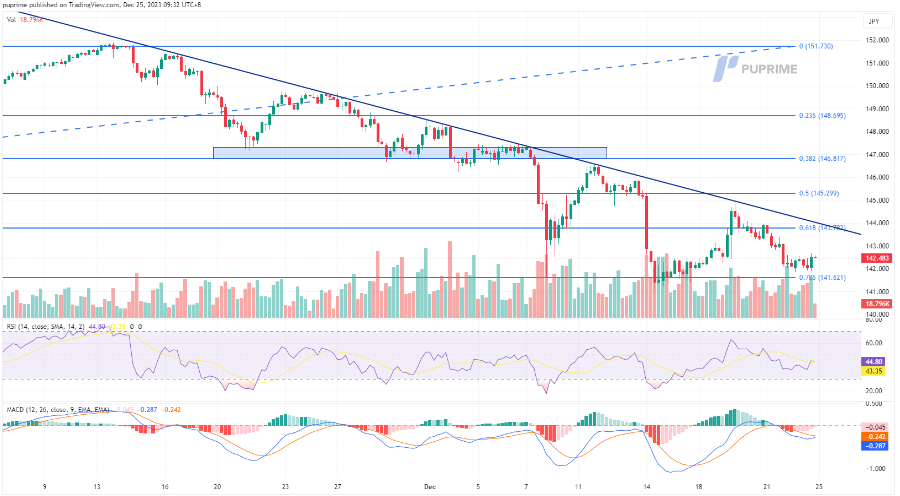
The Japanese yen has continued to exhibit strength despite a downbeat inflation report from Japan. The release of the Bank of Japan (BoJ) meeting minutes last Friday revealed that the board members have initiated discussions on exiting the ultra-loose monetary policy and are laying the groundwork for such a move. This hawkish tilt from the Japanese central bank has contributed to the strength of the Japanese yen.
USD/JPY continues to trade in its long-term downtrend trajectory while is supported at its Fibonacci level of 78.6%; a break below such a level will be a solid bearish signal for the pair. The RSI has been hovering below the 50 level while the MACD failed to break above the zero line, suggesting the bearish momentum remains with the pair.
Resistance level: 143.78, 145.30
Support level: 141.60 138.88
Dow Jones, H4
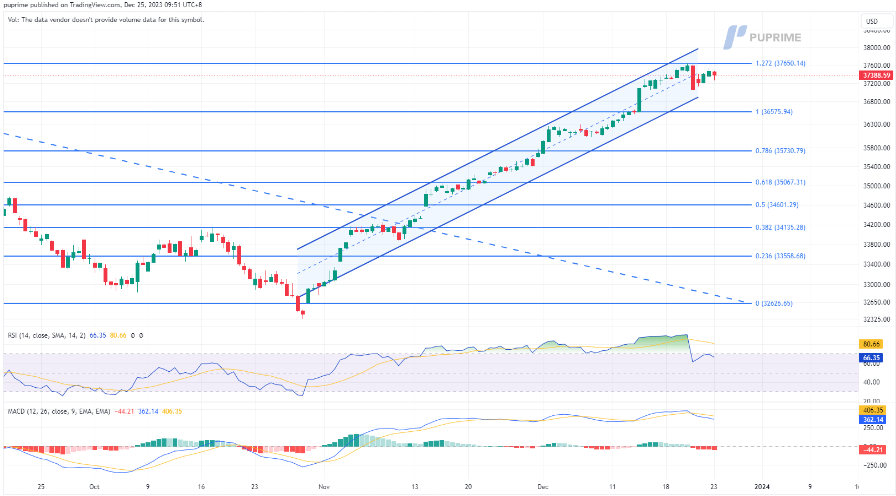
The bullish momentum in US equity markets has been further strengthened by the release of downbeat economic data last week. The disappointing economic indicators suggest that speculation about a dovish tilt from the Federal Reserve is becoming more convincing. This has heightened the risk-on sentiment in the market, propelling the Dow to continue breaking it's all-time high levels. The market's positive reaction to the dovish expectations from the Fed underscores the significant impact central bank policies can have on investor sentiment and market dynamics.
The Dow is trading higher while currently testing the resistance level. However, MACD has illustrated diminishing bullish momentum, while RSI is at 74, suggesting the index might enter overbought territory.
Resistance level: 37650, 39010
Support level: 36575, 35730
CL OIL, H4
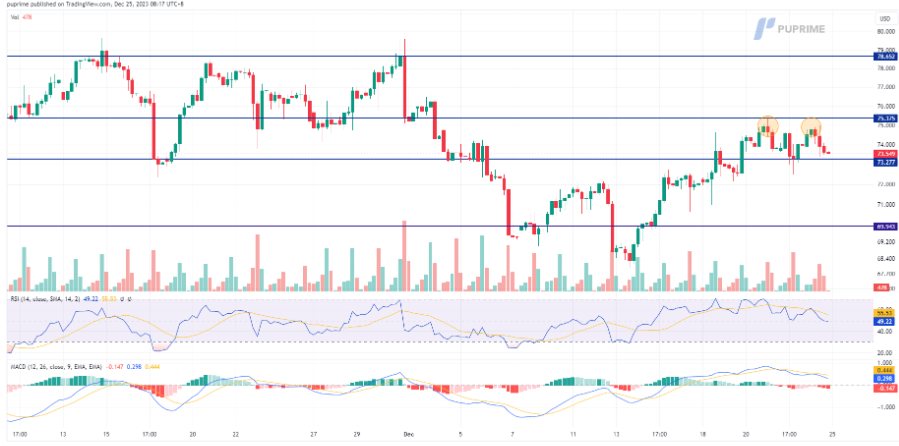
Oil prices saw a modest decline following Angola's decision to exit OPEC. Despite this development, other member states have expressed their commitment to the group. They are poised to work towards stabilising oil prices, particularly as the oil production cut policy is set to be implemented next year. The demand outlook for oil faced additional pressure due to lower-than-expected U.S. economic data, contributing to a more subdued outlook in the oil market.
After a bullish run, oil prices formed a double-top price pattern, suggesting the bullish momentum is easing. The RSI is declining while the MACD has crossed and is dropping to the zero line, suggesting the bearish momentum is forming.
Resistance level: 75.35, 78.65
Support level: 773.20, 69.95


Gold Rallies Beyond Fed Expectations as Treasury Policy Shifts Market Focus

Gold Holds Above $4,300 as Yields Limit Upside Momentum

Global Markets Reprice Risk as Oil, Yields and Central Banks Collide | 2nd September, 2026

Global Bond Selloff, Eyes on Central Banks & US ADP

Attention on JPY Crosses: Intervention Risk Back in Focus

USDJPY (4H): rebound or breakdown at 159.50?

THE US BOND YIELDS SURGE AS POLICY RISKS COLLIDE💥