






Gold extends pullback to three‑week lows near 4,400

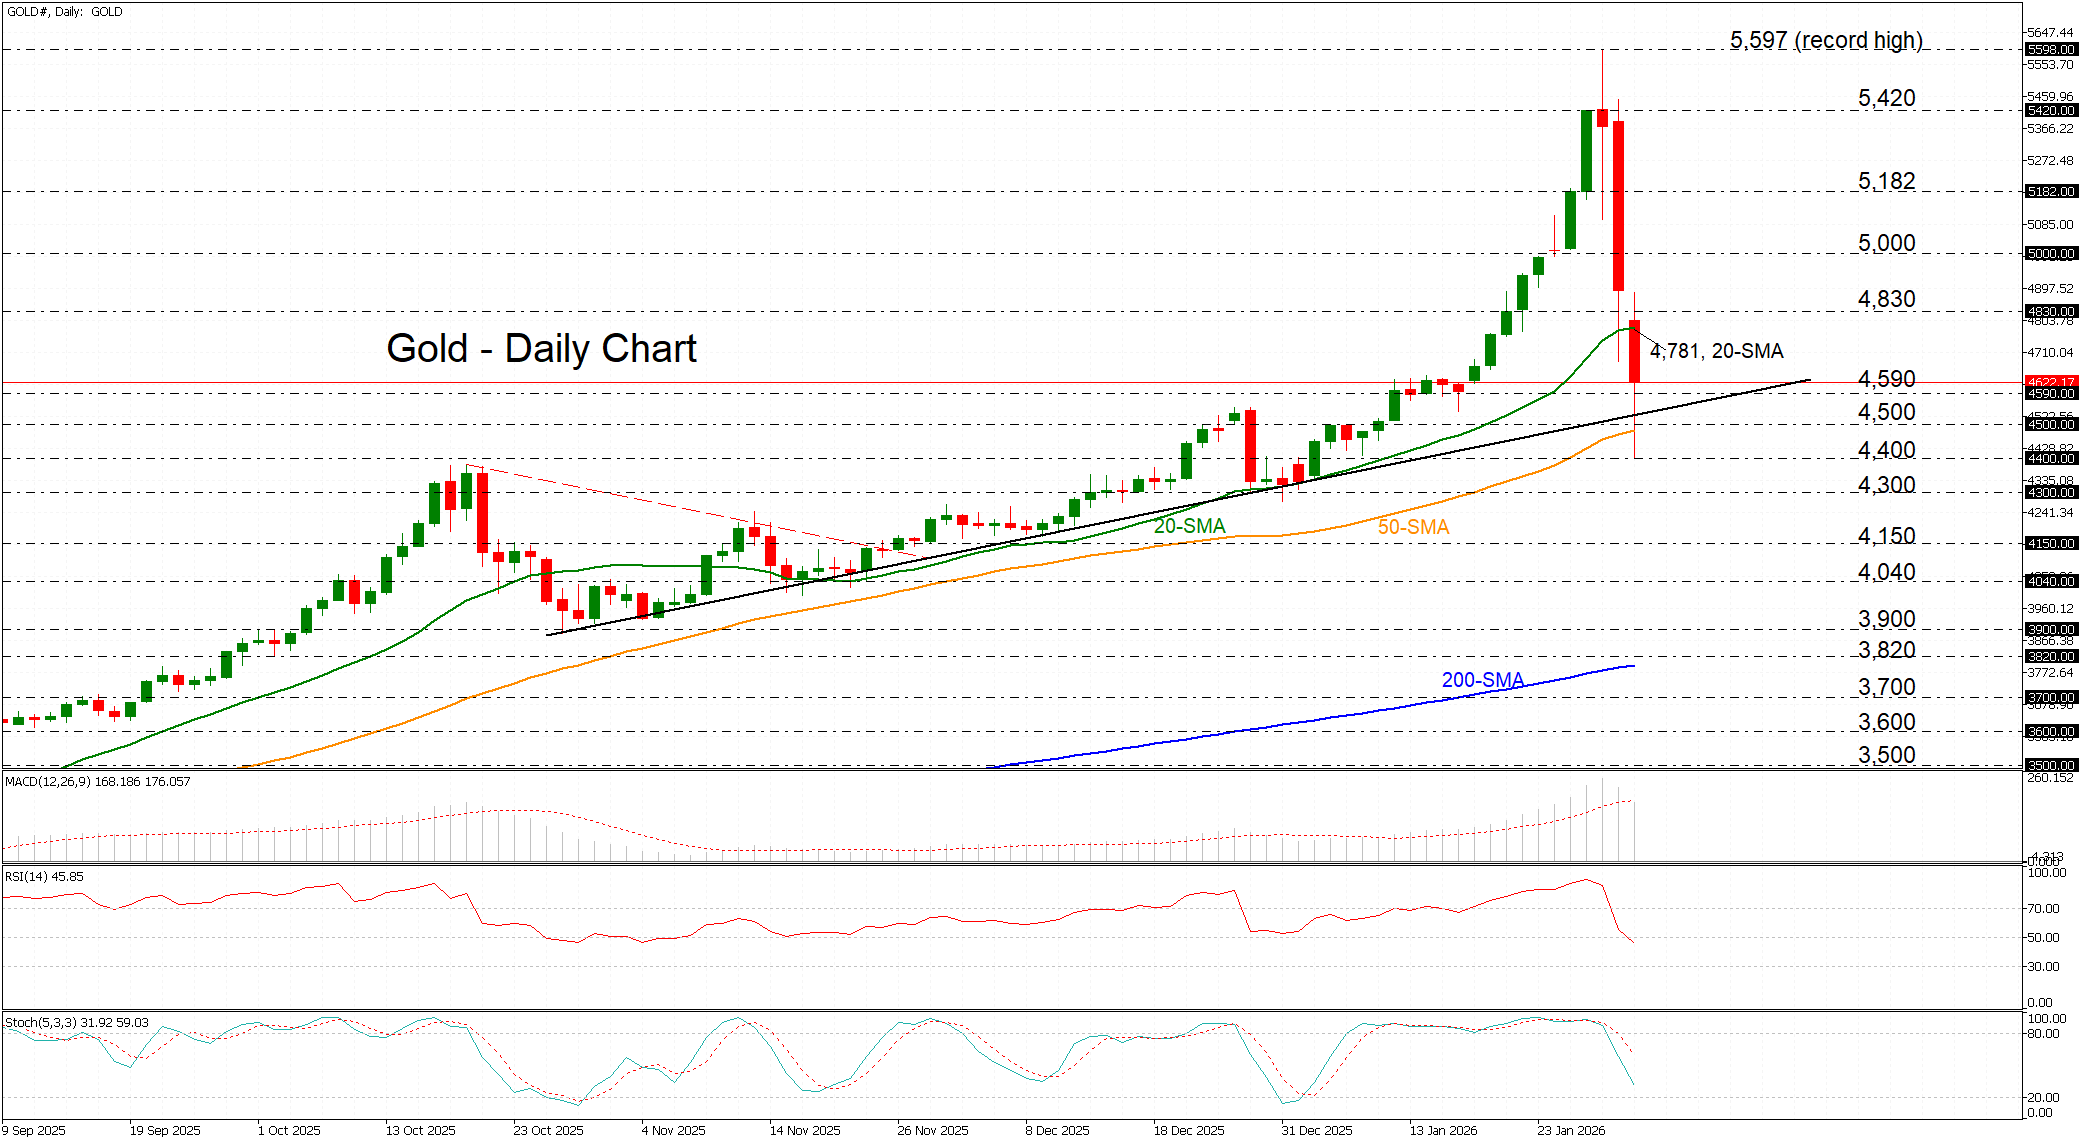
Gold is extending a striking three‑day pullback of more than 20% from its record peak of 5,600, dropping to its lowest level in over three weeks near 4,400. The slump followed the selection of Kevin Warsh as the next US Fed chair, while a stronger dollar has added further pressure on the precious metal.
The price is currently testing support at the short‑term ascending trendline and the 50‑day simple moving average (SMA) – a critical threshold near 4,500. A break below this region could signal the start of a structural downturn, whereas a sustained hold above it would indicate that the current selloff is primarily profit‑taking and likely corrective in nature.
If investors view the decline as a buying opportunity and lift prices above the 20‑day SMA near 4,781, initial resistance may emerge at 4,830, followed by the psychological 5,000 level and the January 27 peak at 5,182.
Despite the slide, gold maintains a longer‑term bullish bias. That said, momentum indicators justify caution at this stage. The MACD remains above zero but has slipped marginally below its red signal line, indicating fading bullish momentum. The RSI and the stochastics are also diving lower, both falling below their neutral midline territories – suggesting further consolidation or a temporary continuation of the selloff cannot be ruled out.
Conversely, if gold breaks below the 4,390-4,400 region – which captures the uptrend line and the 50‑day SMA – the first downside target is the December lows near 4,300, followed by 4,150 and 4,040, before a deeper retracement toward the October uptrend originating near 3,900.
All in all, the crash in gold, which began on Friday with a 9% slump, its steepest single‑day drop in more than a decade, appears to have temporarily halted the record‑breaking rally that saw prices scale a new all‑time high near 5,600 on Thursday. However, the medium‑term outlook remains constructively bullish as long as price action continues to respect the 4,500 threshold for now.


Apple Stock Slips After iPhone 18 Launch as AI Growth Expectations Remain in Focus

US Treasury Triples Long-Term Bond Buyback Size

Oil Breaks Above $100 as Supply Risks Push Brent Higher

Why CPI Data Can Trigger Market Moves Across the Dollar, Gold and Stocks

Brent has soared above $100. Is this just the beginning?
Today Fundamental Analysis: Brent Holds Around $100 Amid Fresh US-Iran Escalations

S&P 500 Stepped From Record Highs, but Market Breadth Is Flashing a Warning 💥