




Gold (XAUUSD) vs. Silver (XAGUSD): Spread-to-ATR Cost Comparison

For day traders and scalpers trading on short timeframes such as M1 and M5, precious metals can offer significant intraday price movements. When choosing between Gold (XAU/USD) and Silver (XAG/USD), many traders focus mainly on the price chart and how quickly the candles move. However, experienced traders also understand that one often-overlooked trading cost can quietly reduce the edge of a short-term strategy: the spread, or the difference between the Bid and Ask prices.
So, how important is spread when day trading Gold versus Silver? And why can looking at the spread alone lead to the wrong conclusion about trading costs?
The Real Cost Difference of Gold vs Silver, Why Is Silver More Expensive Than You Think?
On a trading platform, the spread is the difference between the Ask and Bid prices. For example, at one point in time, the quoted prices were:
XAU/USD: Bid $4,351.66 | Ask $4,351.70 → Bid–Ask spread: $0.04XAG/USD: Bid $64.172 | Ask $64.186 → Bid–Ask spread: $0.014Source: Iux.com
If we only look at the price difference per ounce, Silver appears to have a clear advantage: $0.014 compared with $0.04 for Gold. But for CFDs, that is only part of the story.
Based on the contract specifications provided by IUX, 1 lot of XAU/USD is equivalent to 100 troy ounces, while 1 lot of XAG/USD is equivalent to 5,000 troy ounces. With the spreads observed above, the spread cost for 1 lot of XAG/USD is around $70 ($0.014 × 5,000 oz), compared with around $4 for 1 lot of XAU/USD ($0.04 × 100 oz).
The key point is that a smaller spread per ounce does not necessarily mean a lower spread cost when measured by contract size. Contract size can significantly change the actual trading cost a trader needs to consider when trading the same number of lots.
For a trader holding a position for several days, this difference may not always be the deciding factor. But for day traders and scalpers, whose strategies often aim to capture relatively short price movements, trading costs can take up a more significant part of the expected move.
That is why the important question is not simply, “Which has the lower spread, Gold or Silver?” Instead, it is: “How much of the price movement my strategy is trying to capture is taken up by the spread?”.
How Dynamic Spreads Affect Execution: Gold vs Silver
Spreads are not always fixed. As market conditions change, the Bid–Ask spread can also change depending on liquidity, volatility, and trading demand.
Session Transitions and News Volatility
During session transitions or immediately before major economic news, liquidity conditions can change quickly. Spreads for both assets can widen, especially when volatility rises sharply or the market enters a repricing phase.
Therefore, traders should not treat the spread observed under normal market conditions as a fixed number that applies throughout the trading day.
This is particularly important on M1/M5, where even a relatively small change in spread can become significant if a strategy is targeting a very short price move.
The “Invisible” Ask Price
Some trading platforms display only the Bid price by default. The Ask price (Ask = Bid + Spread) may only be shown when the trader enables it in the platform settings.
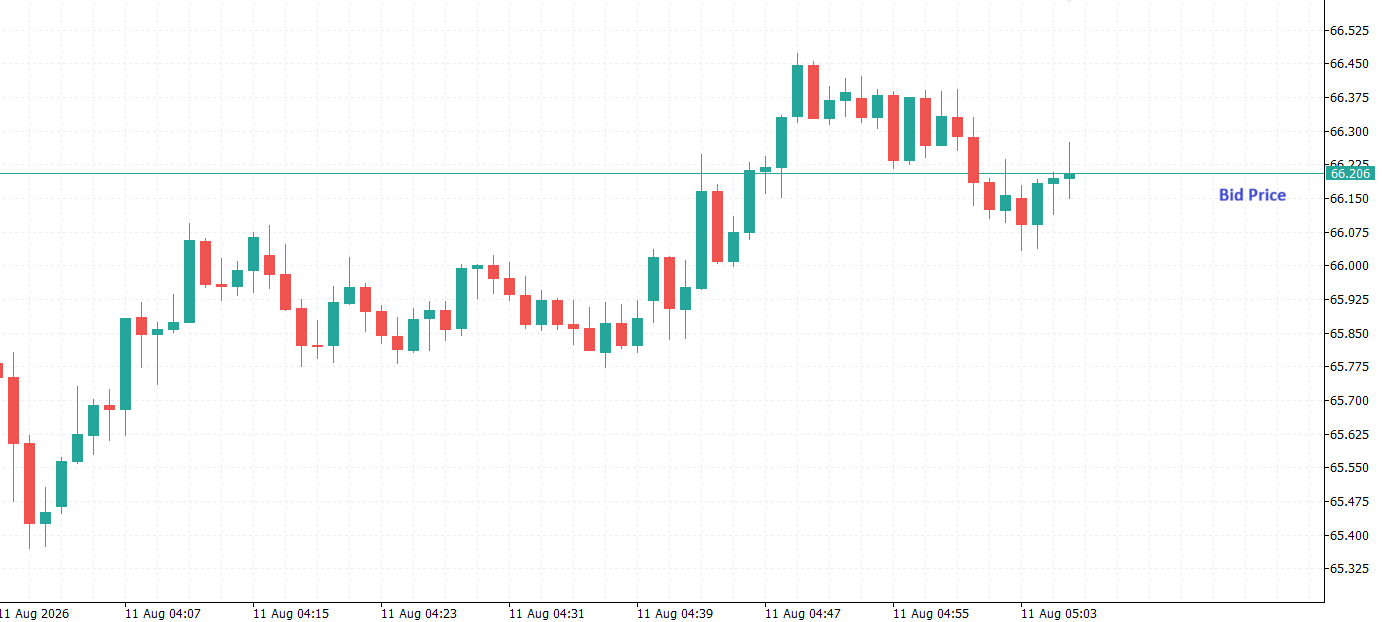
This is particularly important for Short positions. When opening a Sell position, the trader enters at the Bid price, but when closing the Sell position, the relevant price is the Ask.
As a result, a widening spread can cause the Ask price to reach and trigger the Stop Loss of a Short position, even when the trader looks at the Bid price on the chart and sees that price has apparently not reached the Stop Loss level.
This is not an unusual event. It is simply a direct result of the fact that Bid and Ask are two different prices.
What Should Day Traders Watch When Comparing Gold vs Silver?
There is no single product or account type that is suitable for every day trader. However, when trading XAU/USD and XAG/USD on short timeframes, traders can consider several execution-related factors:
Put Spread in Relation to the Trading Range
If a strategy mainly targets very short price movements on M1/M5, the spread can represent a significant part of the expected move. In this case, XAU/USD typically exhibits higher intraday price activity than XAG/USD, which can make the relationship between spread and the price range particularly relevant when analyzing short-term trading strategies.
This does not mean that Silver is only suitable for higher timeframes. A strategy can still trade XAG/USD on M1/M5 if the expected price movement is large enough to absorb the trading costs. However, for strategies with very short targets, traders can check the spread-to-target or spread-to-range ratio before choosing an instrument.
In other words, instead of simply asking, “Which market has the lower spread?”, traders can ask a more practical question: “Which market leaves my strategy with more room after trading costs?”.
Understanding Raw Spread Account Cost Structures
For traders with a high trading frequency, especially scalpers, the account's cost structure can make a significant difference. An account with lower spreads, reasonable commissions, and reasonable slippage can result in lower total trading costs than an account with higher spreads.
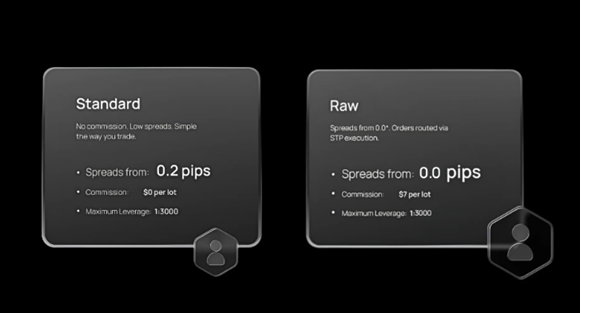
Source: IUX
Therefore, traders can compare the total trading costs associated with different account structures based on the applicable spreads, commissions, slippage and their own trading activity. However, traders should not compare spreads alone. They should compare the total trading cost based on their own trading volume and frequency to determine which account structure better fits their trading style.
Display the Ask Price
Traders can adjust their platform settings to display both the Ask and Bid prices. This makes it easier to see the actual distance between the two prices before entering a trade.
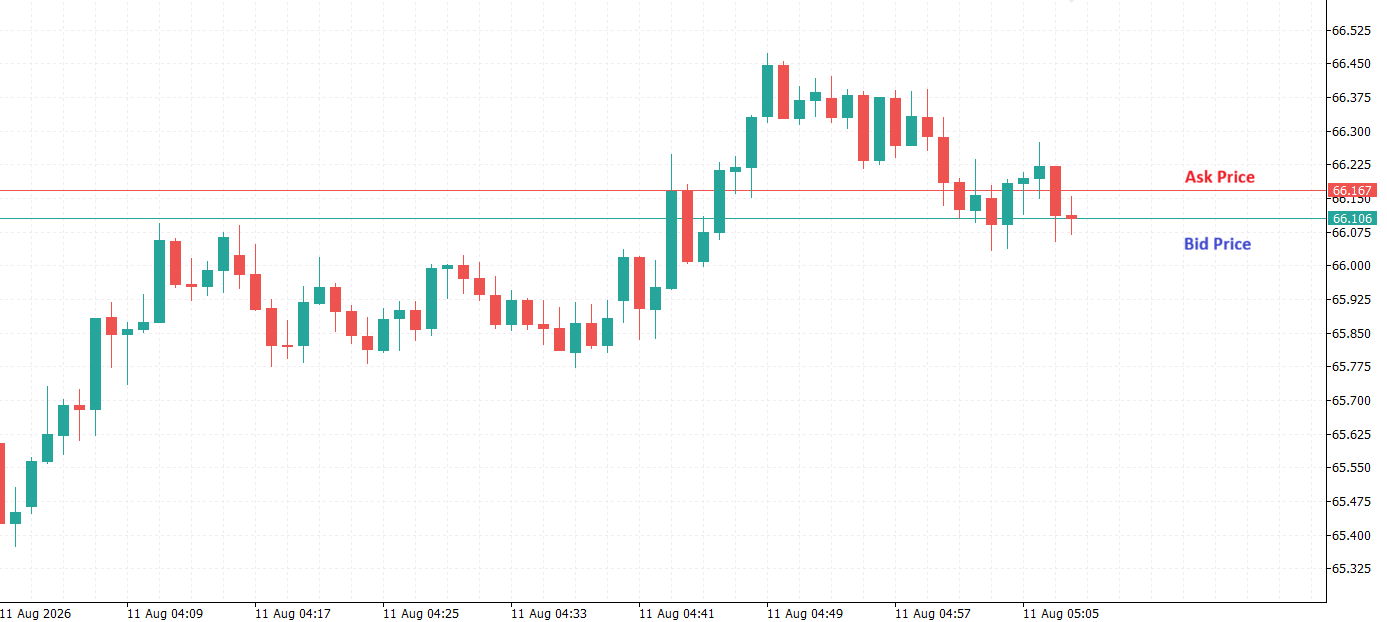
This can be particularly useful when evaluating setups with relatively short targets or Stop Loss levels, as the Bid–Ask spread is part of the execution conditions that traders need to consider.
Consider Liquidity Conditions by Session
Short-term trading activity can vary across market sessions, particularly during periods of overlapping market hours. Traders can monitor actual spread conditions during the periods relevant to their analysis rather than assuming that spreads will always be lower during a particular session.
Instead of only asking, “What is the average spread?”, a more useful question is: “What is the spread when my strategy actually generates a signal?”.
Conclusion
For day traders and scalpers, spread is an important part of trading costs, especially when a strategy targets short price movements.
The Gold vs Silver comparison shows why traders should look beyond the spread per ounce. Contract size, expected price movement, and account structure, including raw spread accounts, can all affect the total cost of trading.
Instead of asking only, “Which market has the lower spread?”, traders should ask: “How much of my strategy’s expected move is consumed by trading costs?”.
Note: This marketing publication is for informational and educational purposes only. It is not an investment recommendation. We do not suggest any investment strategy in this material, nor do we provide investment advice. The material does not take into account your individual financial situation, needs, or investment objectives. It does not constitute a solicitation or invitation to buy, sell, or engage with any product or service of IUX. We have prepared this marketing publication carefully and objectively. We present the facts known to the authors at the time of its creation. We do not include any judgmental elements. Information and research based on historical data or results, as well as forecasts, are not a reliable indicator of the future. We are not responsible for your actions or omissions, especially if you decide to purchase or sell financial instruments based on the information in this marketing publication. We are also not liable for any damages that may result from the direct or indirect use of this information. Investing is risky. Invest responsibly.


US Yields Rise Despite Buybacks; Eyes on ECB Hike

Silver Holds Above $66 as Rate Outlook Limits Recovery

Yen Hits 6-Month High, Volatility Returns After North American Holiday.

Gold Slides Below $4,500 as Strong NFP Revives Fed Hike Bets

US Payrolls Hit 5-Month High as Markets Await CPI This Week.

The dollar is in no hurry to gain ground

Dollar Strength Meets Geopolitical Risk | 7th September, 2026