 (1)-25620261315.jpg)





Today Technical Analysis: Gold jumps 1.5% to $4,134 an ounce. Silver is back above $53

Gold Technical Analysis
Gold shows a bullish short-term structure, trading around $4,111 after another strong recovery from the recent low near $4,000. The precious metal surged to $4,146 during the previous rally before consolidating just below that level. Price remains above the 10-hour and 20-hour moving averages.
The immediate resistance is the recent high around $4,147, while a break above this level could revive the bullish momentum toward $4,168. On the downside, $4,100–$4,080 represents the first important support area, followed by the stronger support around $4,033.
Short-term bias: Bullish, although the recent consolidation suggests some profit taking before another potential attempt to break the $4,147 resistance.
Gold 1H Chart
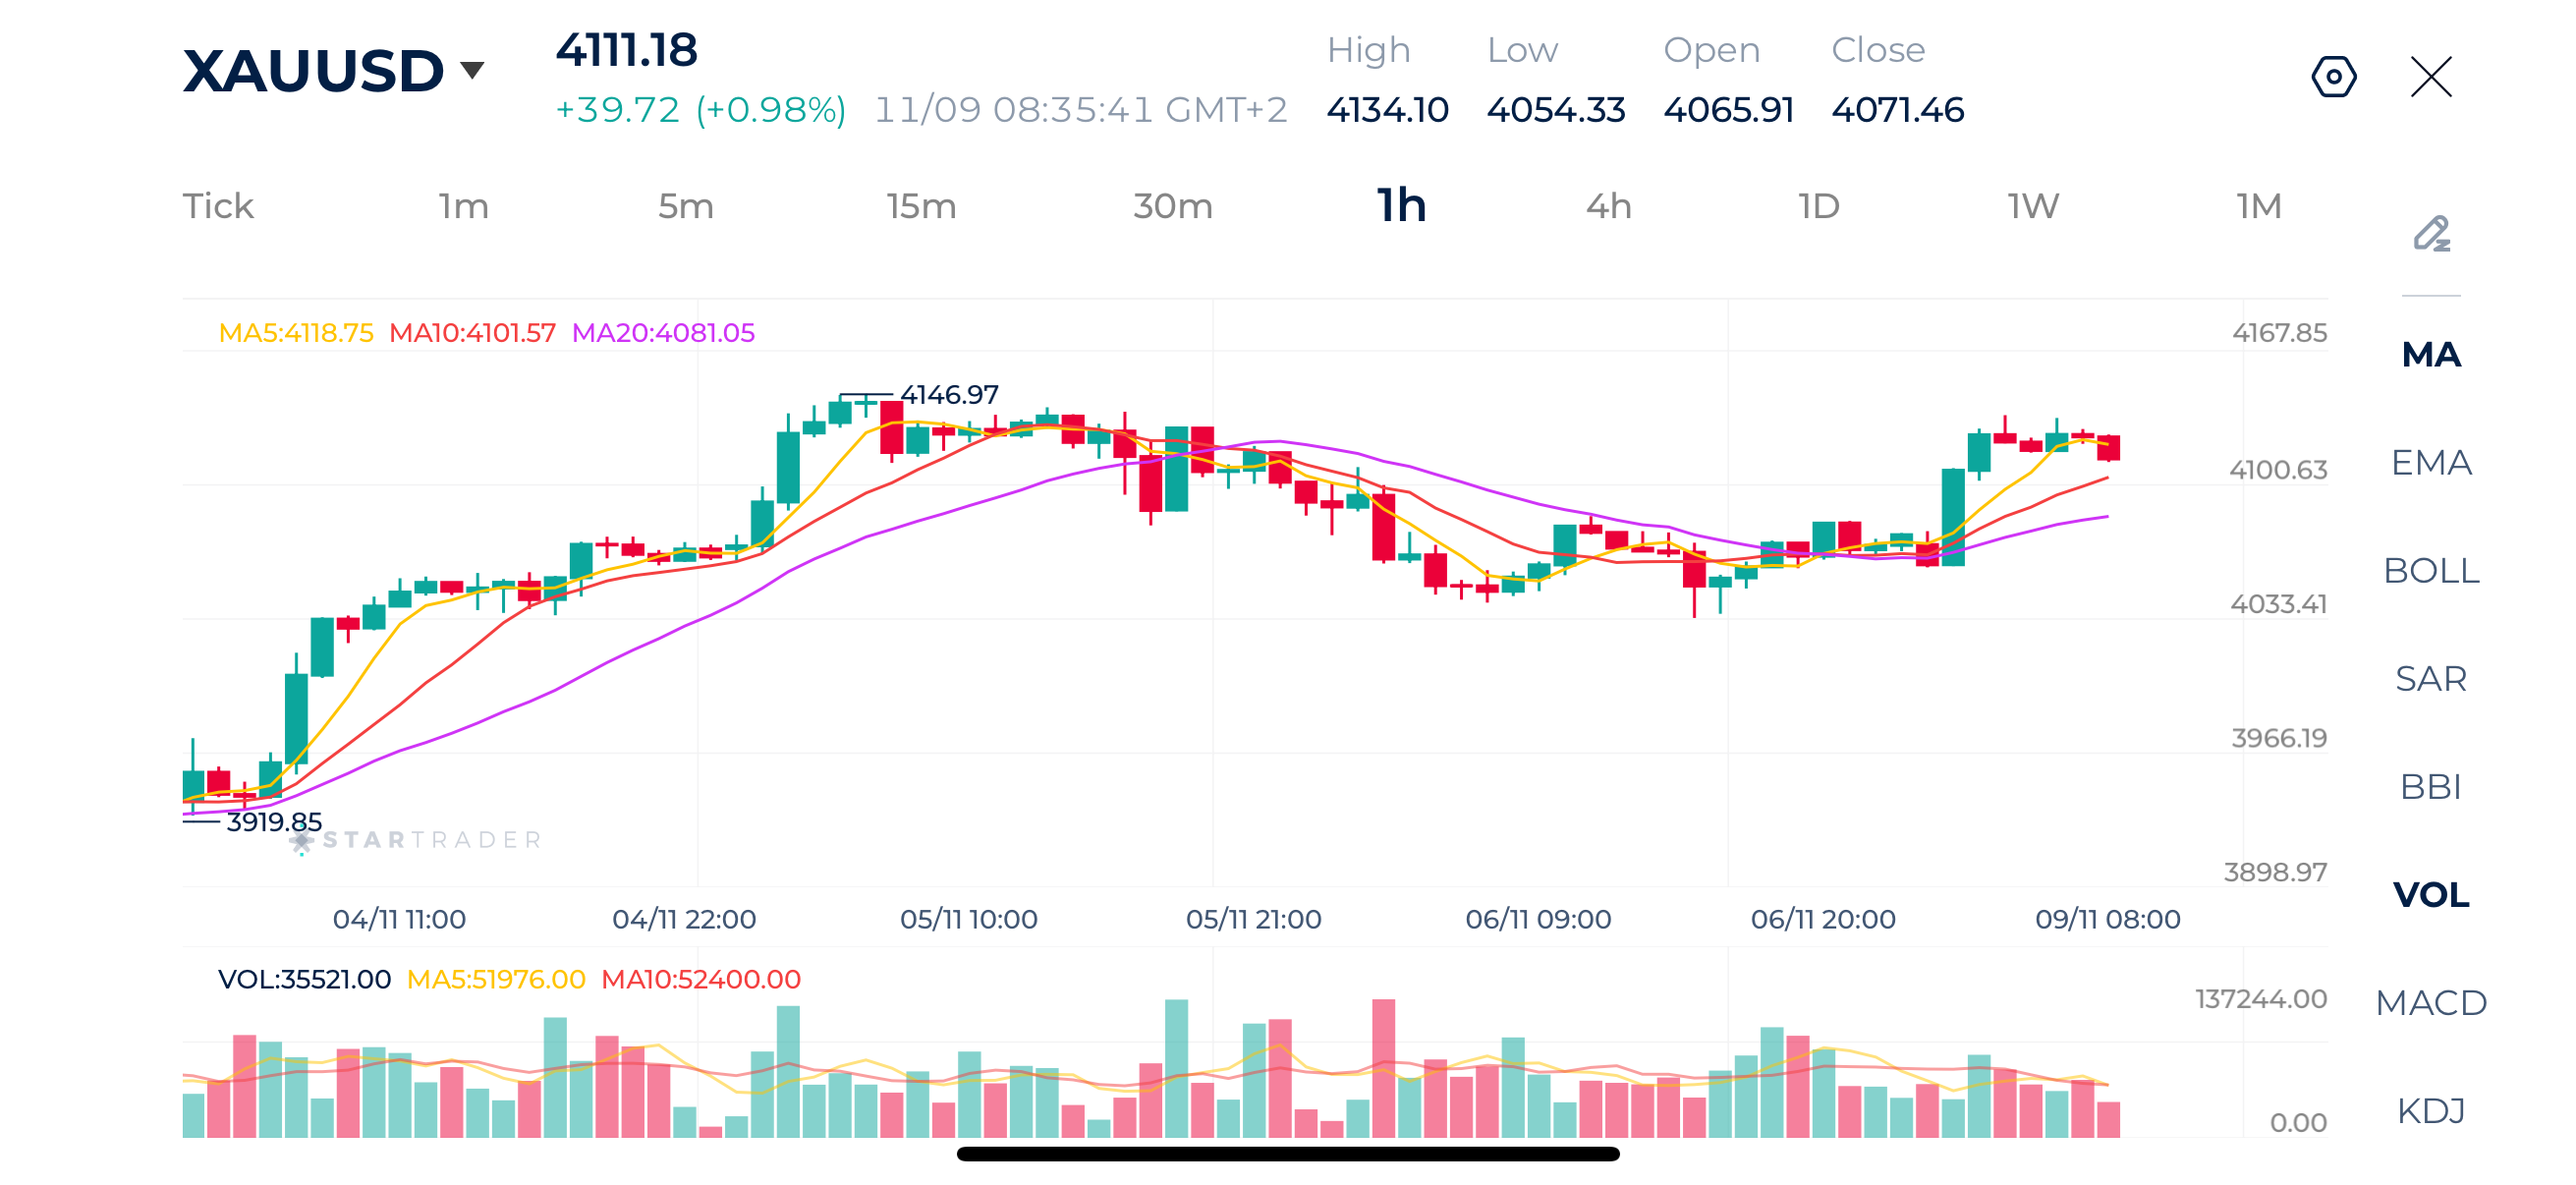
Source: STARTRADER app | Gold continues its recovery from the $4,000 support level

Brent Technical Analysis
Brent remains under clear selling pressure, trading around $99.46 after another decline from the recent recovery high near $103.00. This alignment of the moving averages reinforces the bearish momentum, particularly after price broke back below the psychological $100 level.
The immediate support is around $99.34, followed by the recent low near $96.95. On the upside, $100.50–$101.00 is the first resistance zone, and a sustained recovery above it would be required to improve the technical outlook.
Short-term bias: Bearish, with risks tilted toward another test of $97 if $99.30 fails.
Brent 1H Chart
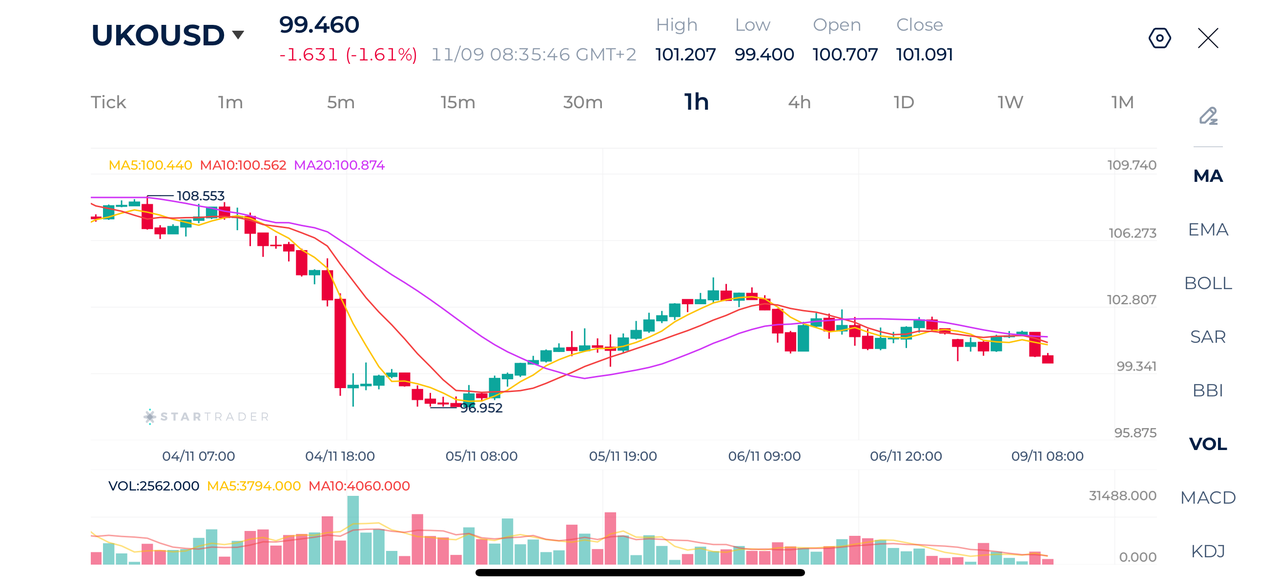
Source: STARTRADER app | Oil prices decline on hopes of progress in peace talks

Nasdaq Technical Analysis
Nasdaq 100 is showing a sideways to bearish short term structure on the 1-hour chart after the sharp sell-off seen earlier in the week. The index dropped from around 28,864 to a low of 26,274, but has since stabilized and spent the last several sessions consolidating around the 26,800–27,300 region.
A sustained break above 27,300 could open the way toward 27,550–27,600, while a break below the recent 26,724–26,274 support zone would signal renewed selling pressure.
Short-term bias: Neutral to Bearish, with 27,300 acting as the key level needed to confirm a stronger recovery.
Nasdaq 1H Chart
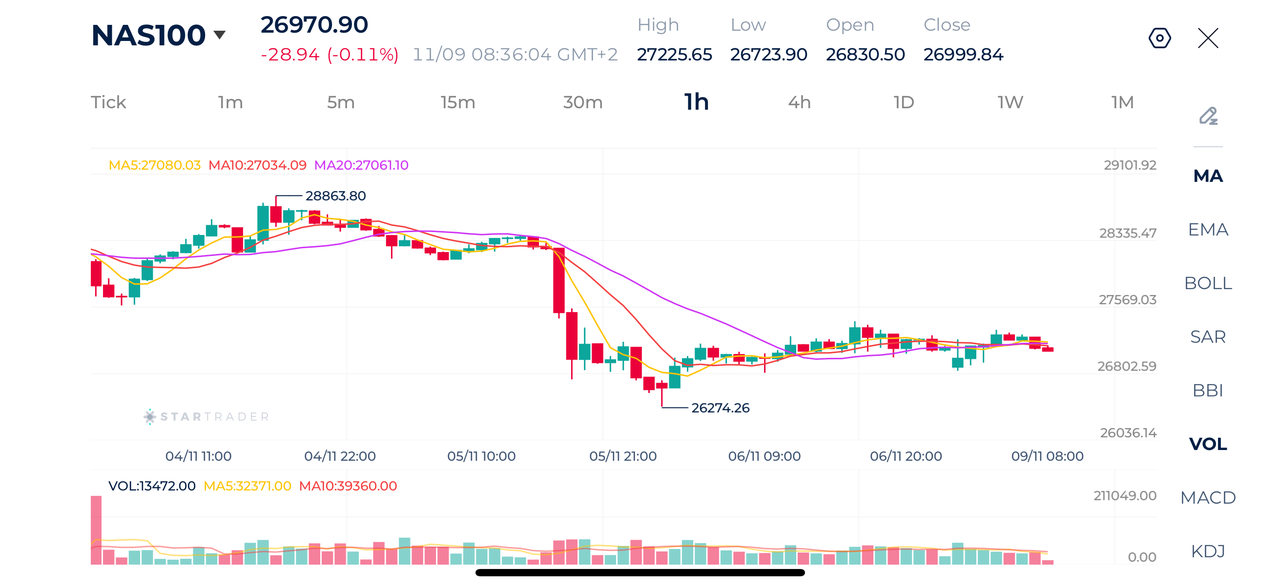
Source: STARTRADER app | Nasdaq shows signs of recovery after last week's intense sell-off

Risk Disclaimer: This material is provided for informational purposes only and does not constitute a recommendation or investment advice. Trading financial instruments on margin involves substantial risk and may not be appropriate for all investors.


Today Fundamental Analysis: Asian tech stocks close higher, oil prices fall on hopes of progress in peace talks

Investors Are Heavily Long the US Dollar

The S&P 500 is counting on support from the Fed

Sterling’s Rebound Faces US Inflation Hurdle

EURUSD plummeted from its high

Gold, GBPUSD, EURUSD

Crypto is testing an important trend line