 (1)-25620261315.jpg)





Today Technical Analysis: Gold prices rebound from key technical support of $4,000

Brent Technical Analysis
Brent crude is trading at $115.57 after retreating from its recent high of $118.23. The moving averages indicate a mixed short term picture. Short-term momentum has improved following the recent rebound, but the broader intraday trend has not fully recovered. The price remains below the 20-hour moving average, which is acting as a potential dynamic resistance level.
Immediate resistance lies around $116.00–$116.30, followed by $117.0 and the recent high at $118.23. A sustained break above $116.30 would strengthen the recovery and could open the way toward $117.00. On the downside, initial support lies around $114.20, followed by $113.60 and $112.80. A break below $114.20 would suggest that the correction is resuming, potentially exposing the lower support levels. Overall, Brent has a neutral-to-bearish short term outlook while trading below 116.00–116.30, although the broader recovery structure would remain more constructive if buyers defend the $113.60–$114.20 region.
Brent 1H Chart
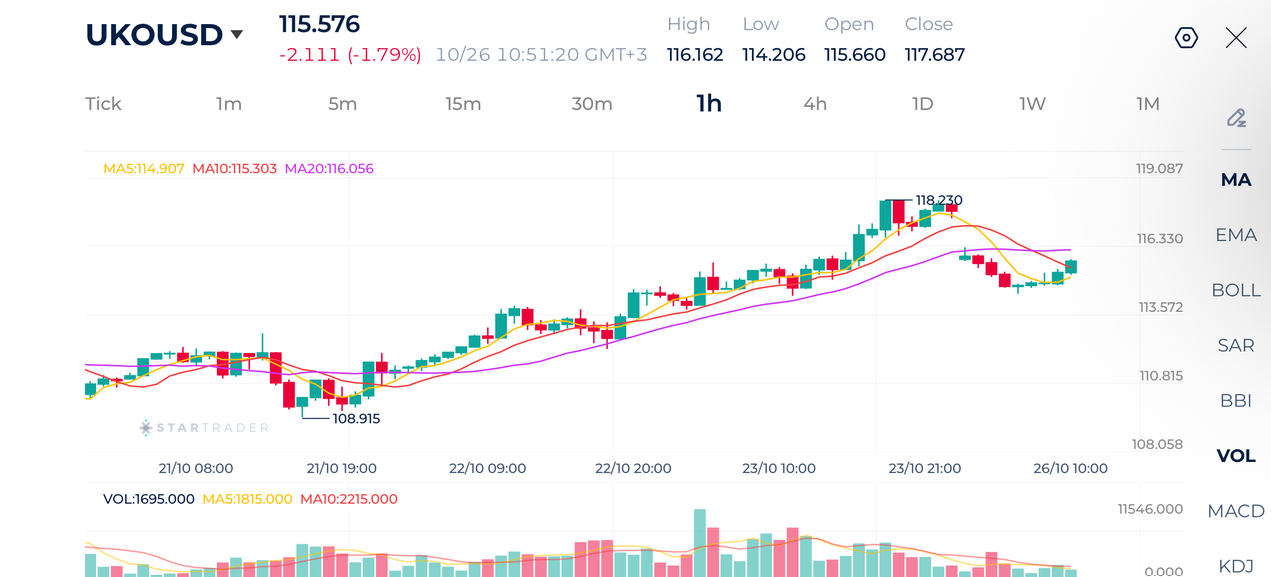
Source: STARTRADER app | Crude brent declines at the open on hopes of easing tensions in the Middle East

Nasdaq-100 Technical Analysis
Nasdaq 100 continues to trade under pressure following its sharp decline from the recent high of 29,957. The 1-hour chart shows a sequence of lower highs and lower lows, with the index falling toward the 28,838 support area before entering a sideways consolidation phase. Recent price action has been relatively subdued, with the index oscillating around 29,000 as buyers attempt to stabilize the market. However, the recovery remains weak, and there is no clear indication of a bullish reversal yet.
The moving averages reflect this loss of momentum. The current price is below all three averages MA(5), MA(10), and MA(20), which are tightly clustered and relatively flat.
Immediate support is located around 28,886–28,838, with a break below this zone potentially exposing 28,735. On the upside, initial resistance lies around 29,000–29,015, followed by 29,067 and 29,400. A sustained recovery above 29,067 would improve the short-term outlook, while a break above 29,400 would provide stronger evidence of a recovery. For now, the bias remains bearish to neutral, with the index vulnerable to another decline if the 28,838 support area fails.
Nasdaq-100 1H Chart
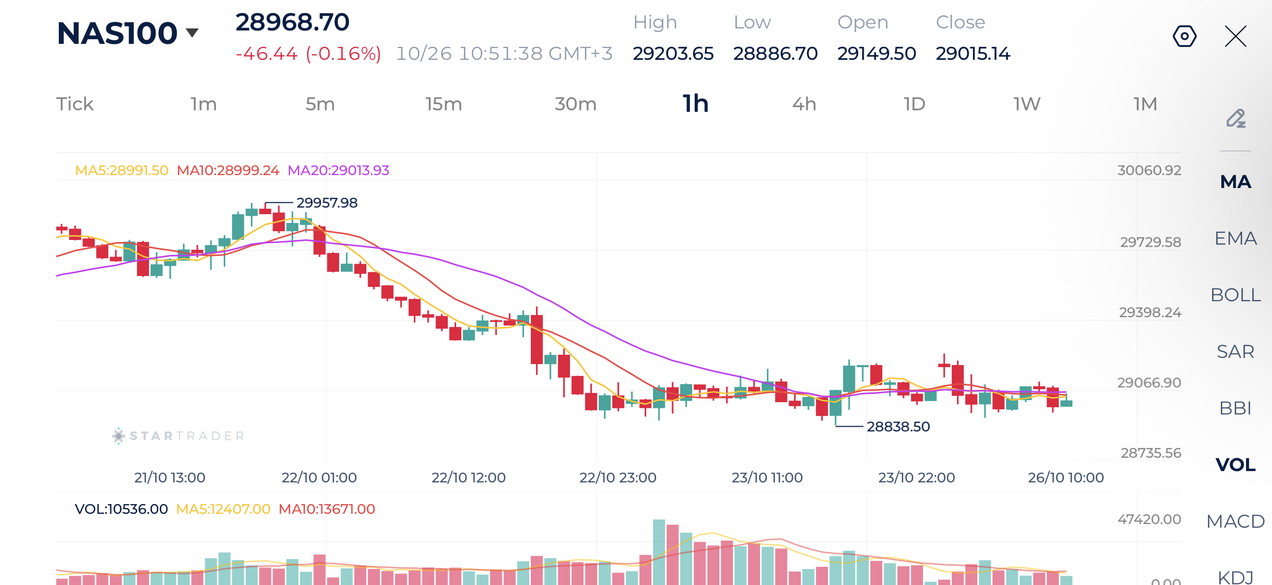
Source: STARTRADER app | Nasdadq-100 attempts to stabilize around 29,000

Gold Technical Analysis
Gold is trading just above $4,000 after an extended decline from the recent high of $4,146. The 1-hour chart shows persistent selling pressure. The latest candles suggest that buyers are attempting to defend the psychological $4,000 level.
The moving averages are beginning to show signs of short-term stabilization. Bearish momentum has eased in the immediate term, but a clear bullish trend has not yet emerged. The broader decline remains important, and the averages could act as resistance if gold fails to sustain its recovery above the recent consolidation range.
Immediate support lies around $3,996–$3,975, with a break below $3,975 potentially exposing the $3,960 area. On the upside, initial resistance lies around $4,011–$4,020, followed by $4,035 and $4,060. A sustained move above $4,020 would strengthen the recovery, while a break above $4,035–$4,060 would provide more convincing evidence that the correction is losing control. Overall, gold has a neutral-to-bearish bias, with the $4,000 level acting as a key pivot. Holding above this area could support further consolidation or a technical rebound, whereas a renewed break below $3,975 would reinforce the bearish trend.
Gold 1H Chart
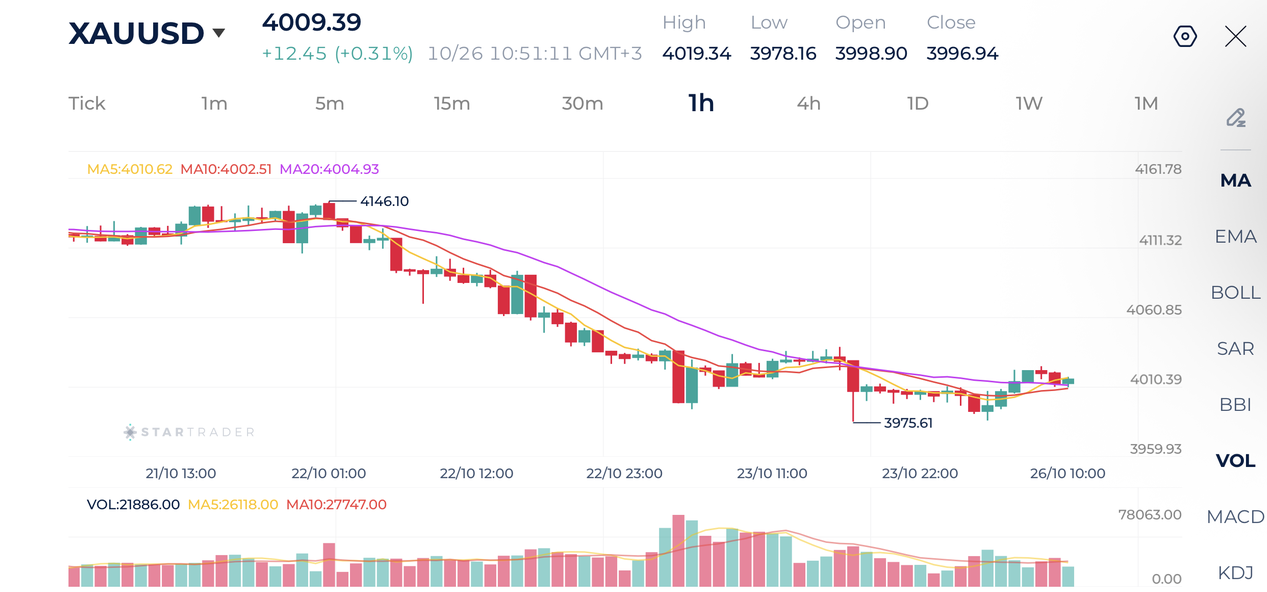
Source: STARTRADER app | Gold attempts to stabilize above the $4,000 psychological level

Risk Disclaimer: This material is provided for informational purposes only and does not constitute a recommendation or investment advice. Trading financial instruments on margin involves substantial risk and may not be appropriate for all investors.


The S&P 500 braces for a storm

Central banks are in no hurry

Daily Fundamental Analysis: US stock futures open higher following last week’s decline

USD/JPY: The Dollar Still Owns the Carry, but Japan Is Starting to Push Back

Gold: Oversold rebound before bears strike again?

Fragile risk appetite as investors prepare for a crucial week

The crypto market is drifting down