





Grafik NZDJPY
Kurs Dolar Selandia Baru vs Yen Jepang (NZD ke JPY)
-0.13% -11.3 pips
Grafik Harga Langsung NZDJPY
Acara Mendatang untuk NZD dan JPY
|
Acara
|
Sebelumnya.
|
konsensus
|
|||
|---|---|---|---|---|---|
|
44m
Rendah
|
JPY | 117.6 |
118
|
||
|
44m
Rendah
|
JPY | 120.6 |
118.7
|
||
|
3j 44m
Menengah
|
JPY | 55% | |||
|
3j 44m
Menengah
|
NZD | 89% | |||
|
21j 19m
Rendah
|
NZD | 3.708% | |||
|
21j 19m
Rendah
|
NZD | 3.133% |
3.109%
|
||
|
21j 19m
Rendah
|
NZD | 3.283% | |||
|
1h
Menengah
|
NZD | 2.75% |
3%
|
||
|
1h
Menengah
|
NZD | ||||
|
1h
Rendah
|
JPY |
Suku Bunga RBNZ dan BOJ
| Negara | Bank Sentral | Kurs Saat Ini | Kurs Sebelumnya | Rapat Berikutnya |
|---|---|---|---|---|
| New Zealand | Reserve Bank of New Zealand | 2.75% | 2.5% | 1 hari |
| Japan | Bank of Japan | 1.25% | 1.0% | 3 hari |
Berita NZDJPY Terbaru

NZ Dollar Rises Amid RBNZ Rate Hike Prospects

NZ Dollar Rises Against Majors

Yen Rises Amid Risk-off Mood

Yen Rises Against Majors
Analisis untuk NZDJPY

Yen Strengthens Amid Global Market Uncertainty What to Expect Next

AUDJPY, AUDUSD, EURGBP, EURJPY, EURUSD, GBPJPY, GBPUSD, NZDJPY, NZDUSD, USDCAD, USDCHF, USDJPY, USD Index, Gold, & S&P 500

AUDJPY, AUDUSD, EURGBP, EURJPY, EURUSD, GBPJPY, GBPUSD, NZDJPY, NZDUSD, USDCAD, USDCHF, USDJPY, USD Index, Gold, & S&P 500

AUDJPY, AUDUSD, EURGBP, EURJPY, EURUSD, GBPJPY, GBPUSD, NZDJPY, NZDUSD, USDCAD, USDCHF, USDJPY, USD Index, Gold, & S&P 500
Analisis Nilai Tukar NZDJPY
NZDJPY Data Historis - Data historis NZDJPY dapat dipilih berdasarkan rentang tanggal dan kerangka waktu.
Volatilitas NZDJPY - Analisis volatilitas mata uang secara real-time NZDJPY.
Korelasi NZDJPY - Analisis korelasi mata uang NZDJPY secara real-time.
Indikator NZDJPY - NZDJPY indikator real-time.
Pola NZDJPY - Pola harga real-time NZDJPY.
Analisis Teknis NZDJPY
| Pola | Beli (6) | Jual (3) |
|---|---|---|
| Belt-hold |
h1
|
|
| Closing Marubozu |
m15
|
|
| Doji |
d1, mn
|
|
| High-Wave |
d1, mn
|
|
| Hikkake |
m1, h4
|
|
| Long Legged Doji |
d1, mn
|
|
| Long Line |
h1
|
|
| Matching Low |
h4
|
|
| Rickshaw Man |
d1, mn
|
|
| Short Line |
w1
|
|
| Spinning Top |
mn
|
d1
|
Spread Live





.jpg)




Aktivitas Grafik
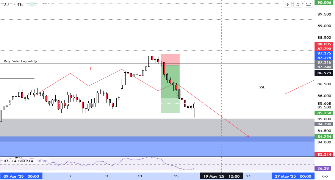
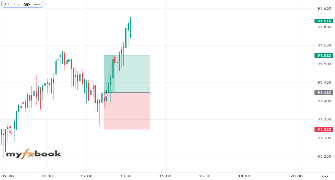
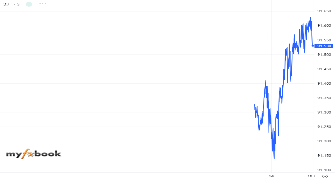
Peta Heatmap
| 1 menit | |
| 5 menit | |
| 15 menit | |
| 30 menit | |
| 1 jam | |
| 4 jam | |
| Harian | |
| Mingguan | |
| Bulanan |
Apa itu NZDJPY?
NZDJPY adalah nilai tukar yang menunjukkan berapa nilai 1 unit Dolar Selandia Baru (NZD) dalam Yen jepang (JPY).
Trader menggunakan NZDJPY untuk berspekulasi pada pergerakan harga Dolar Selandia Baru terhadap Yen jepang tanpa memiliki aset fisiknya.
Berapa nilai 1 NZDJPY hari ini?
Harga saat ini untuk 1 NZDJPY adalah 89.407.
Harga ini diperbarui secara real-time berdasarkan aktivitas pasar dan likuiditas di berbagai sesi trading global.
Berapa harga Bid dan Ask untuk NZDJPY?
- Harga bid: 89.407
- Harga ask: 89.520
Selisih antara keduanya dikenal sebagai spread.
Berapa rentang harian NZDJPY?
Rentang perdagangan harian NZDJPY hari ini berada di antara 89.366 dan 89.550.
Rentang ini mencerminkan volatilitas intraday dan membantu trader menilai potensi risiko serta peluang.
Apa sentimen NZDJPY?
Anda dapat melihat sentimen pasar terkini untuk NZDJPY, termasuk posisi long dan short dari trader di seluruh dunia, di Sentimen Forex NZDJPY Myfxbook.
Berapa ukuran pip untuk NZDJPY?
Ukuran pip untuk NZDJPY adalah 0.01.
Ukuran pip ditentukan oleh format harga instrumen dan dapat berbeda antara mata uang, logam, dan pasar lainnya.
Bagaimana cara menghitung ukuran posisi untuk NZDJPY?
Anda dapat menghitung ukuran posisi yang tepat untuk NZDJPY dengan mudah berdasarkan ukuran akun dan persentase risiko menggunakan kalkulator ukuran posisi Myfxbook.
Bagaimana cara menghitung profit atau kerugian untuk trade NZDJPY?
Untuk mengestimasi potensi profit atau kerugian dari trade NZDJPY, gunakan Kalkulator Profit Myfxbook.
Faktor apa saja yang memengaruhi harga NZDJPY?
Harga NZDJPY dipengaruhi oleh kombinasi faktor pasar dan ekonomi, termasuk:
- Penawaran dan permintaan atas aset yang mendasarinya
- Data makroekonomi dan indikator ekonomi
- Kebijakan bank sentral dan keputusan suku bunga
- Sentimen pasar dan selera risiko
- Perkembangan geopolitik dan peristiwa global
- Rilis data ekonomi utama dan komunikasi bank sentral dapat meningkatkan volatilitas





