





USDCNH Chart
Dolar AS vs Yuan Tiongkok Exchange Rate (USD to CNH)
+0.01% +4.7 pips
USDCNH Live Price Chart
Upcoming Events for USD and CNH
|
Event
|
Prev.
|
Cons.
|
|||
|---|---|---|---|---|---|
|
7h 40m
High
|
USD | 1779K |
1780K
|
||
|
7h 40m
High
|
USD | 207.25 |
206
|
||
|
7h 40m
High
|
USD | 206K |
205K
|
||
|
7h 40m
Low
|
USD | 4.7% |
4.4%
|
||
|
7h 40m
Med
|
USD | 0.2% |
0.3%
|
||
|
7h 40m
Low
|
USD | 0.4% |
0.3%
|
||
|
7h 40m
Low
|
USD | 156.563 |
157
|
||
|
7h 40m
Low
|
USD | 4.2% |
4.6%
|
||
|
7h 40m
Low
|
USD | 4.7% |
5.3%
|
||
|
7h 40m
High
|
USD | 0% |
0.4%
|
Suku bunga
| Country | Bank Sentral | Current Rate | Previous Rate | Next Meeting |
|---|---|---|---|---|
| United States | Federal Reserve | 3.75% | 3.75% | 6 days |
Latest USDCNH News

U.S. Job Growth Far Exceeds Estimates In August

U.S. Employment Jumps Far More Than Expected In August

U.S. Services PMI Rises To Six-Month High In August

U.S. Trade Deficit Widens To Largest Since March 2025 In July
Analysis for USDCNH

USDCNH Falls Towards Multi-Year Low as Yuan Gains Support

USDCNH Steadies Amid Dollar Pressure and Seasonal FX Demand

USDCNH Slides as Yuan Hits Multi-Year Peak

Yuan Holds Steady as Fed Decision Keeps Traders Cautious
USDCNH Exchange Rates Analysis
USDCNH Data Historis - Historical USDCNH data selectable by date range and timeframe.
USDCNH Volatility - USDCNH real time currency volatility analysis.
USDCNH Correlation - USDCNH real time currency correlation analysis.
USDCNH Indicators - USDCNH real time indicators.
USDCNH Patterns - USDCNH real time price patterns.
USDCNH Technical Analysis
| Pattern | Buy (15) | Sell (2) |
|---|---|---|
| Belt-hold |
m30, d1, w1
|
|
| Closing Marubozu |
m30, d1
|
|
| Doji |
m15
|
|
| Engulfing Pattern |
h4
|
|
| Hanging Man |
h4
|
|
| High-Wave |
m15, h4
|
|
| Long Legged Doji |
m15
|
|
| Long Line |
m30, d1
|
|
| Marubozu |
m30, d1
|
|
| Piercing |
m30
|
|
| Short Line |
h4
|
|
| Spinning Top |
m5, m15, h4
|
m1
|
Live Spreads
| Pialang | USD/CNH |
|---|---|
 Open Account
|
- |
 Open Account
|
- |
 Open Account
|
- |
 Open Account
|
- |
.webp) Open Account
Open Account
|
- |
 Open Account
|
- |
 Open Account
|
- |
 Open Account
|
- |
.webp) Open Account
Open Account
|
- |
 Open Account
|
- |
Charts Activity
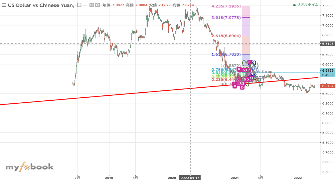
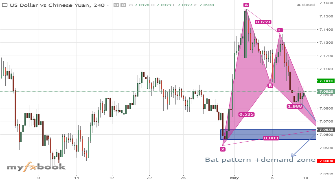
Heat Map
| 1 minute | |
| 5 minutes | |
| 15 minutes | |
| 30 minutes | |
| 1 hour | |
| 4 hours | |
| Daily | |
| Weekly | |
| Monthly |
Apa itu USDCNH?
USDCNH adalah nilai tukar yang menunjukkan berapa nilai 1 unit Dolar Amerika (USD) dalam Lepas Pantai Yuan Cina (CNH).
Trader menggunakan USDCNH untuk berspekulasi pada pergerakan harga Dolar Amerika terhadap Lepas Pantai Yuan Cina tanpa memiliki aset fisiknya.
How much is 1 USDCNH today?
The current price of 1 USDCNH is 6.7055.
This price updates in real time based on market activity and liquidity across global trading sessions.
What is the Bid and Ask price for USDCNH?
- Bid price: 6.7055
- Ask price: 6.7050
The difference between them is known as the spread.
What is the daily range of USDCNH?
The daily trading range of USDCNH today is between 6.7019 and 6.7068.
This range reflects intraday volatility and helps traders assess potential risk and opportunity.
What is the sentiment of USDCNH?
You can check the current market sentiment for USDCNH, including long vs short positions from traders worldwide, on Myfxbook USDCNH Forex Sentiment.
What is the pip size for USDCNH?
The pip size for USDCNH is 0.001.
Pip size is defined by the instrument’s price format and may vary between currencies, metals, and other markets.
How do I calculate position size for USDCNH?
You can easily calculate the correct position size for USDCNH based on your account size and risk percentage using Myfxbook’s position size calculator.
How do I calculate profit or loss for USDCNH trades?
To estimate potential profit or loss for a USDCNH trade, use the Myfxbook Profit Calculator.
What factors affect the price of USDCNH?
The price of USDCNH is influenced by a combination of market and economic factors, including:
- Supply and demand for the underlying assets
- Macroeconomic data and economic indicators
- Central bank policies and interest rate decisions
- Market sentiment and risk appetite
- Geopolitical developments and global events
- Major economic releases and central bank communications can increase volatility





