 (1)-25620261315.jpg)





Daily Technical Analysis: Gold Extends Losses to $3,840 as Selling Pressure Intensifies

Gold Technical Analysis
Gold remains under significant selling pressure. with price now around $3,840. The 1-hour chart confirms the bearish momentum, with price recently breaking below the $3,870 area. The immediate support is the latest low around $3,832–$3,833, and a sustained break below it could open the way toward $3,815 and potentially the $3,775–$3,800 zone. Resistance is around $3,870–$3,880, followed by $3,900–$3,930. The technical bias remains bearish unless gold can reclaim$ 3,900–$3,930.
Gold 1H Chart 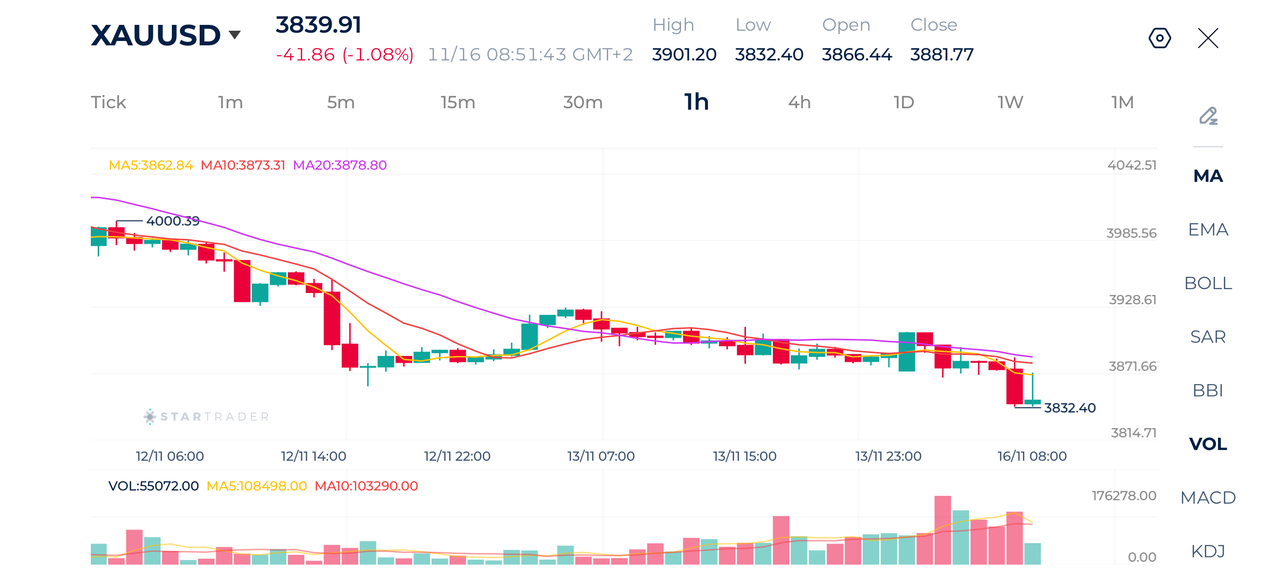
Source: STARTRADER app | Gold prices continue to slide further, trading at a year low
| Resistance | $3,870 | $3,900 | $3,935 |
| Support | $3,815 | $3,775 | $3,750 |
Brent Technical AnalysisBrent crude has found support near $96.30–$96.00 and has since recovered toward $98.00. On the 1-hour chart, the latest candles showing renewed buying interest. Immediate resistance is around $98.30–$99.20, with a break above $99.20 potentially opening the way toward $100–$101. Support is around $97.10, followed by $96.30–$96.00. The short-term bias has shifted modestly bullish, but the medium term trend remains bearish.
Brent 1H Chart
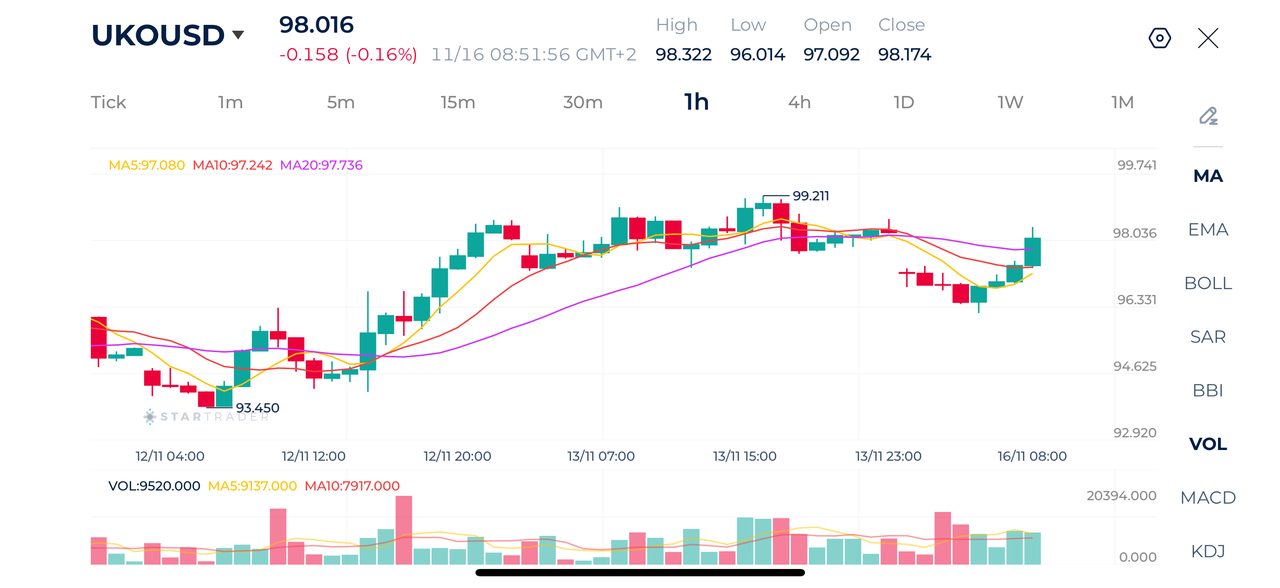 Source: STARTRADER app | Crude brent recoups some of the losses from Friday as it reaches $98 a barrel
| Resistance | $98.30 | $99.20 | $100.00 |
| Support | $97.10 | $96.30 | $95.75 |
S&P 500 Technical Analysis
The S&P 500 is showing clear short term weakness on the 1-hour chart after failing to sustain the rebound from the 7,504 low. Price is now around 7,531 and trading below the 5-, 10- and 20-period moving averages, with the short-term averages beginning to slope lower. The recent structure shows lower highs and lower lows, keeping the immediate bias bearish. The first important support is around 7,504, and a break below this level would expose 7,490–7,475. On the upside, resistance is around 7,555–7,565, followed by 7,580–7,600. A recovery above 7,565 would be needed to weaken the current bearish setup.
S&P 500 1H Chart
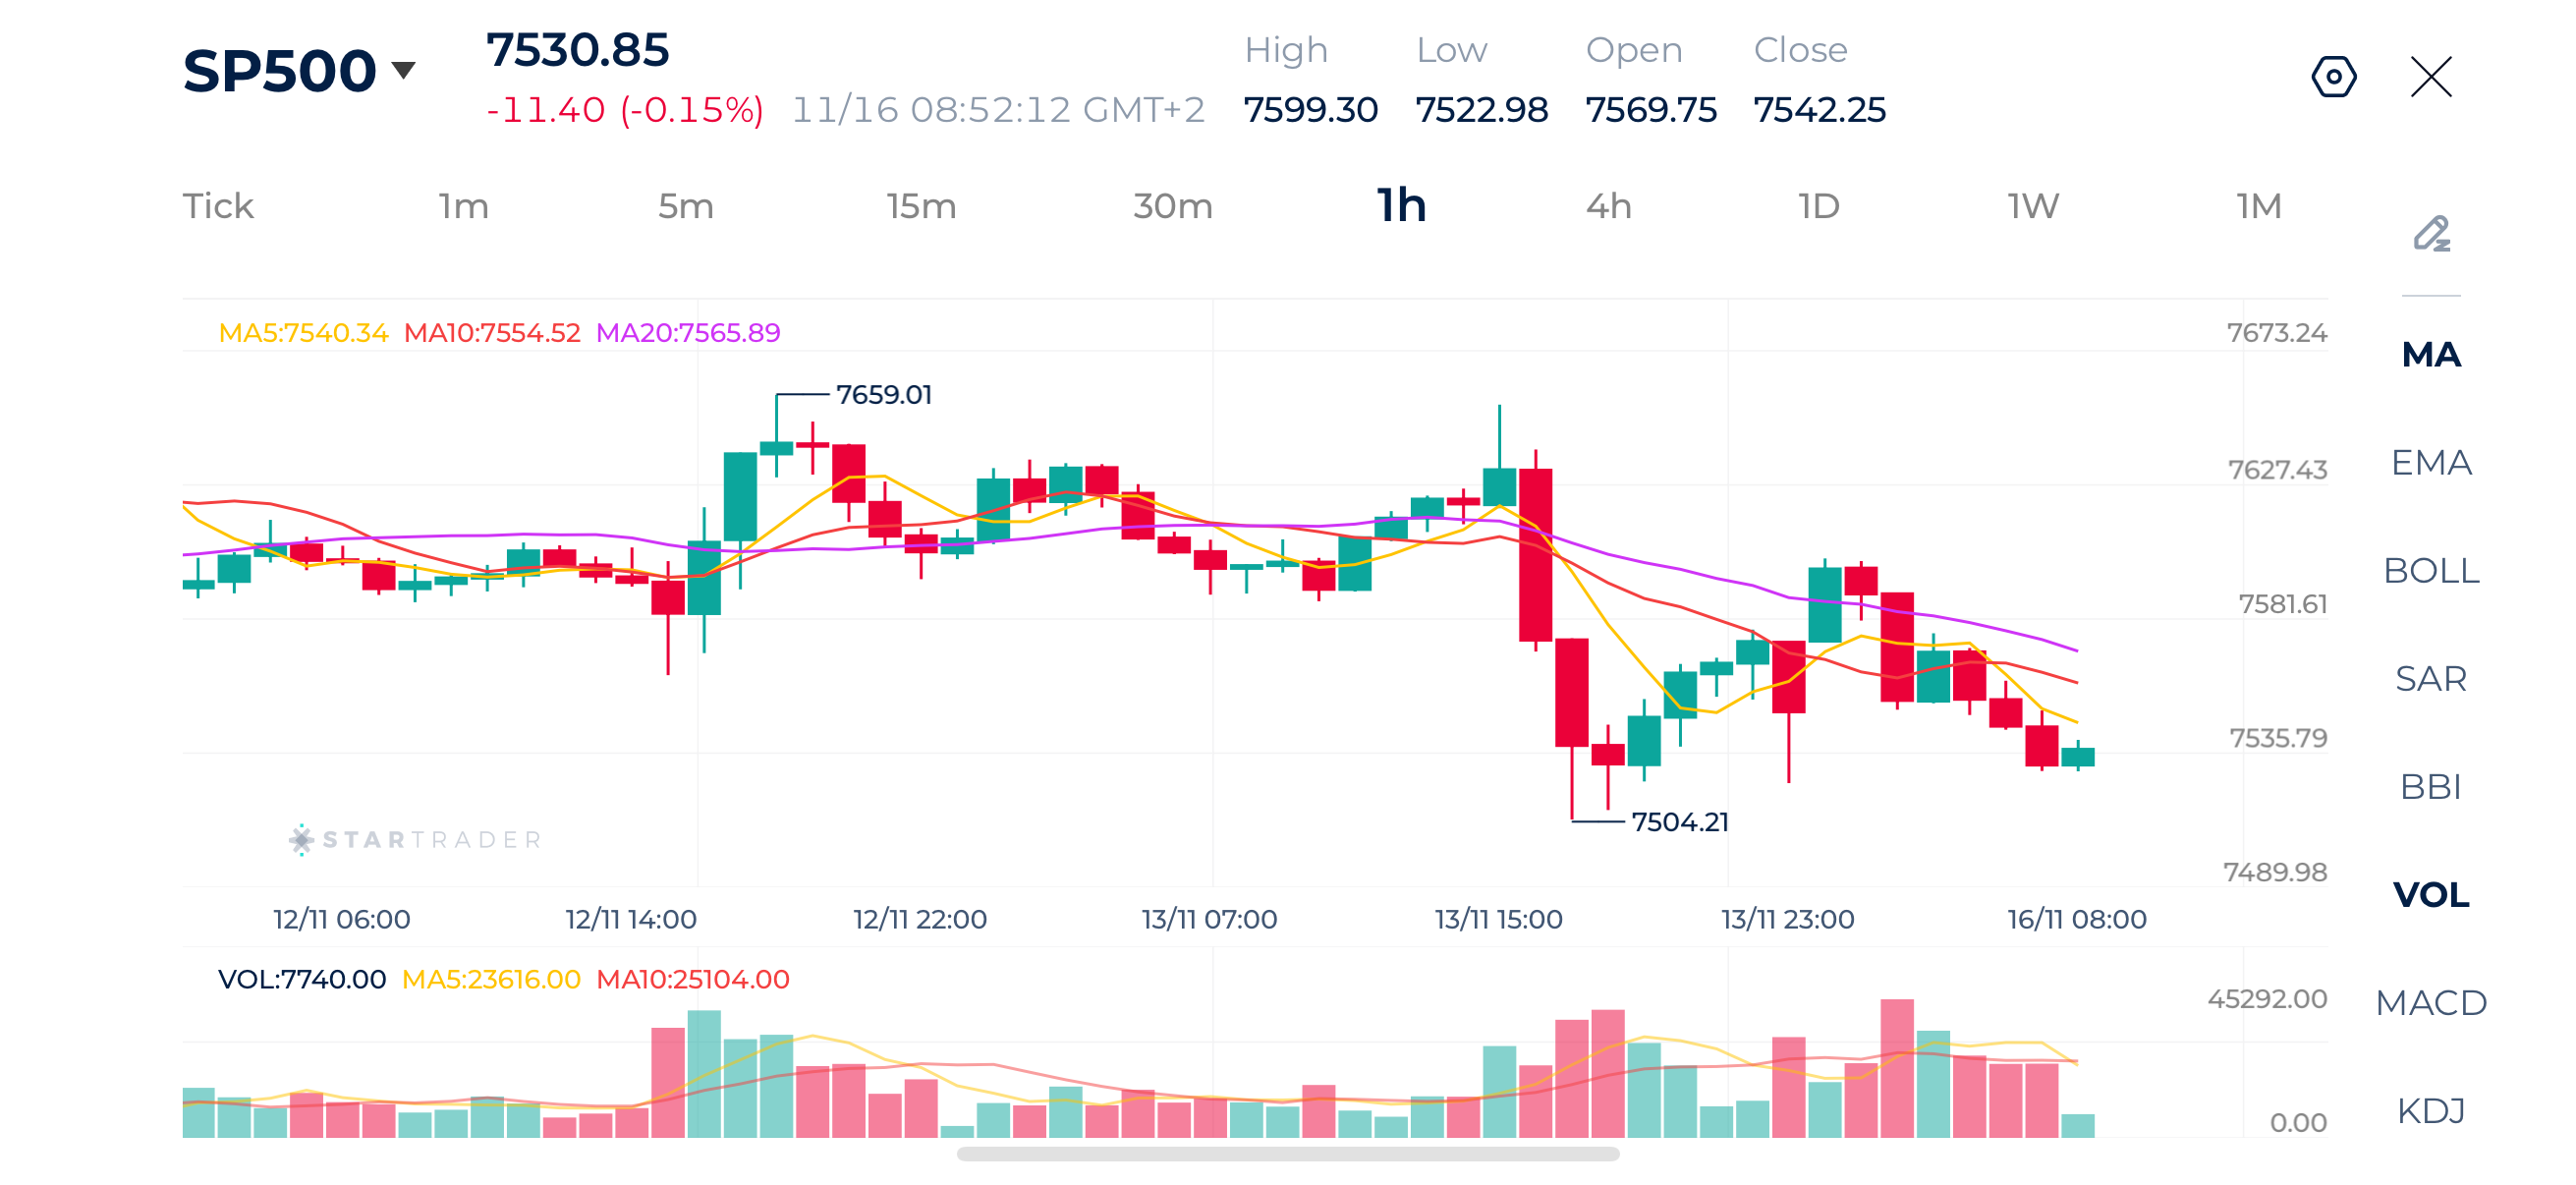 Source: STARTRADER app | S&P 500 remain under pressure following last week's intense sell-off
| Resistance | 7,585 | 7,630 | 7,665 |
| Support | 7,504 | 7,481 | 7,450 |
Risk Disclaimer: This material is provided for informational purposes only and does not constitute a recommendation or investment advice. Trading financial instruments on margin involves substantial risk and may not be appropriate for all investors.


Technical Analysis – GBPUSD rebounds from one-month lows after five-day slide

Tech Tremors and Hawkish Fed Pressures Trigger Broad Risk-Off Reset
EBC Markets Briefing | Yen moves sideways after unexpected GDP contraction

Daily Fundamental Analysis: stock indices trade lower as Nvidia continues to weigh on market sentiment

Yen Intervention Risk Builds as Dollar Momentum Cools and Precious Metals Attempt to Stabilize | 17th November, 2026

Dollar Index Hits 19-Month High as Demand for Dollar Strengthens

Wall Street Slides as AI Fears Hit Nvidia and Chip Stocks Ahead of Earnings