 (1)-25620261315.jpg)





Daily Technical Analysis: Gold Reclaims $3,900 After Hitting Its Lowest Level Since October 2025

Gold Technical Analysis – Renewed selling pressure following a failed recovery
Gold continues to struggle following its significant decline from the recent high of $4,068. The precious metal previously found support around $3,870 and staged a recovery toward the $3,970 area. However, this rebound failed to develop into a sustained bullish reversal, with sellers returning and pushing prices lower again.
The moving averages are beginning to reflect this deterioration. Gold is currently trading below all three averages MA(5), MA(10), and MA(20).
Immediate support is located around $3,910, followed by $3,870, the recent swing low. A decisive break below $3,870 could expose the $3,850 area. On the upside, initial resistance stands around $3,934–$3,939, followed by $3,969 and $4,028. A sustained move above $3,970 would improve the recovery outlook, while a break above $4,028 would provide stronger evidence of a potential trend reversal.
Short-term outlook: Bearish. The latest recovery has lost momentum, and gold remains vulnerable to further downside unless buyers can reclaim the $3,940 area.
Gold 1H Chart
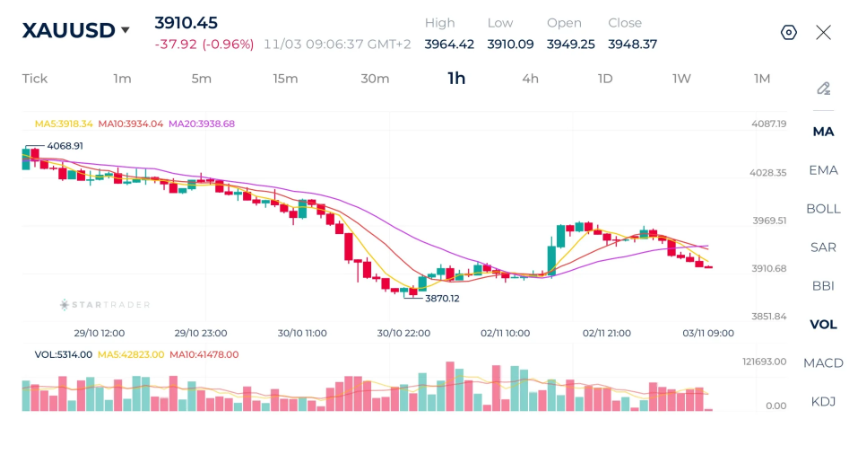
Source: STARTRADER app | Gold rebounds from yearlow low and trades above $3,900

Nasdaq Technical Analysis – Bearish momentum remains dominant
The Nasdaq 100 remains under significant selling pressure, extending the bearish correction observed over the previous sessions. After failing to recover above the 30,000 psychological level, the index has continued to form lower highs and lower lows.
The moving averages reinforce the negative outlook. The index is trading below all three moving averages MA(5), MA(10), and MA(20), while their bearish alignment confirms that downside momentum remains dominant.
Immediate support is located around 27,928, followed by 27,762, which represents the next visible support area on the chart. A decisive break below 27,762 could open the door to further losses. On the upside, initial resistance stands around 28,052, followed by 28,257 and 28,831. The index would need to reclaim the 28,257 area to signal a meaningful improvement in its technical structure.
Short-term outlook: Bearish. The downside trend remains intact, and any recovery toward the moving averages could encounter renewed selling pressure.
Nasdaq 1H Chart
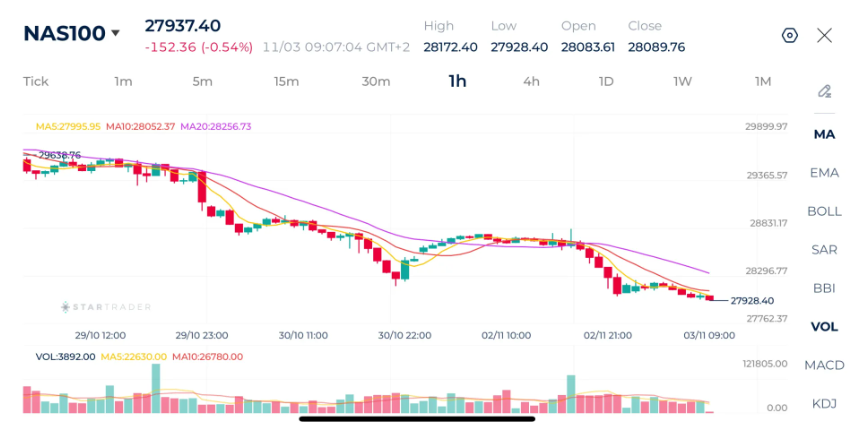
Source: STARTRADER app | US stocks remain under pressure as tech sell-off continues

Brent Technical Analysis – Strong rebound, but the broader trend remains vulnerable
Brent crude is staging a strong recovery after experiencing a sharp sell-off from its recent high. The decline accelerated toward $107.27, where the market attracted buying interest and began recovering.
The moving averages MA(5), MA(10), and MA(20) remain relatively close to one another, meaning the market still needs further upside confirmation before establishing a stronger bullish trend.
Immediate resistance is located around $111.00, followed by $113.03 and $116.44. A sustained break above $111.00 could extend the recovery toward the $113.00 area. On the downside, initial support stands around $109.60, followed by $109.00 and the recent low of $107.27. A break below $107.27 would invalidate the current recovery structure and expose the market to renewed selling pressure.
Short-term outlook: Cautiously bullish. The recovery is gaining momentum, although Brent needs to maintain its position above $109.60 and break through $111.00 to strengthen the bullish outlook.
Brent Chart
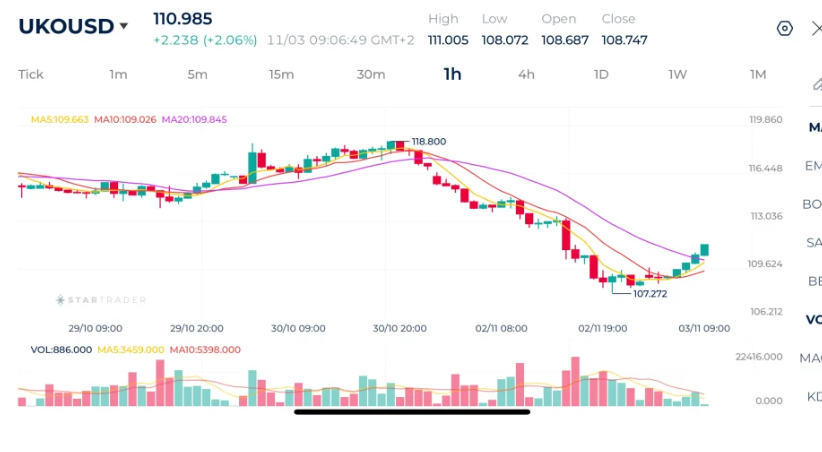
Source: STARTRADER app | Oil jumps 2.7% today after the US attacks Qeshm Island

Risk Disclaimer: This material is provided for informational purposes only and does not constitute a recommendation or investment advice. Trading financial instruments on margin involves substantial risk and may not be appropriate for all investors.


Gold buying by central banks has hit its highest rate since 2024.

Daily Fundamental Analysis: Wall Street Starts November on a Cautious Note Ahead of US Midterm Elections

Bitcoin tests key support as election uncertainty and tech sell-off weigh

Will gold climb back above $4,000?

Crypto turns gloomy

US midterm elections in the spotlight as stock market rout persists

EBC Markets Briefing | Euro firms after oil prices fell sharply