 (1)-25620261315.jpg)





Daily Technical Analysis: Oil prices rise. Brent breaks September‘s high

Gold Technical Analysis
Gold is trading at $4,128. Following its recent high of $4,198, the precious metal has entered a clear downward move, with successive lower highs and lower lows.
The moving averages reinforce the negative outlook. Price is below all three averages MA(5), MA(10), and MA(20). This configuration suggests that selling pressure continues to dominate and that any recovery could encounter resistance near the moving-average cluster.
Immediate support lies around $4,115–$4,120, followed by $4,100 and the lower area around $4,091. A decisive break below $4,115 could extend the decline toward these levels. On the upside, initial resistance lies around $4,135–$4,143, followed by $4,149–$4,150. A sustained move above $4,150 would signal that the market is beginning to recover, while a break above $4,178 would be needed to materially improve the short-term outlook. Overall, gold remains bearish while trading below $4,143–$4,150.
Gold 1H Chart
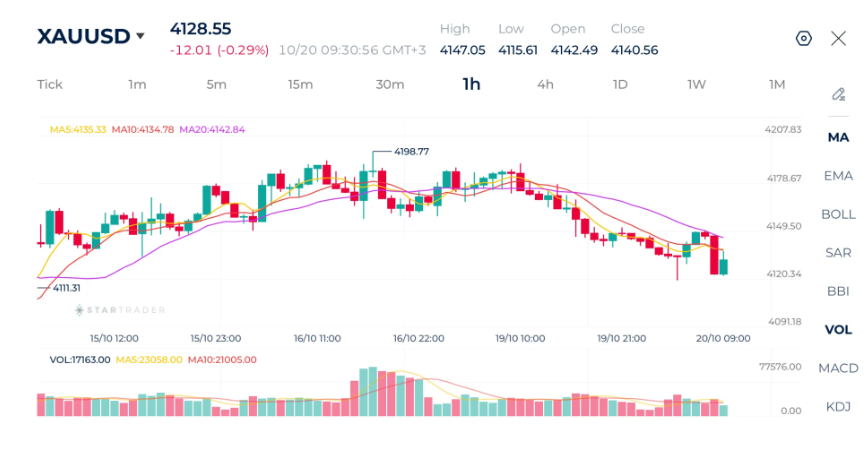
Source: STARTRADER app | Higher yields and a stronger dollar keep gold under pressure

Brent Technical Analysis
Brent crude is trading at $111.75. The market has recovered strongly from its recent low of $105.87, establishing a sequence of higher lows and higher highs.
The moving averages confirm the bullish structure. Price is above all three averages MA(5), MA(10), and MA(20), and they are arranged in bullish order.
Immediate support is located around $111.30–$111.00, followed by $110.80 and the broader $109.20 area. Resistance stands at $112.42 with the next potential upside area around $113.00. A sustained break above $112.42 could extend the rally toward $113.00 and higher levels. Conversely, a move below $111.00 would weaken the immediate bullish structure, while a break below $110.8 would suggest a deeper correction. Overall, the technical outlook remains bullish, although the market is approaching a level where profit-taking could emerge.
Brent 1H Chart
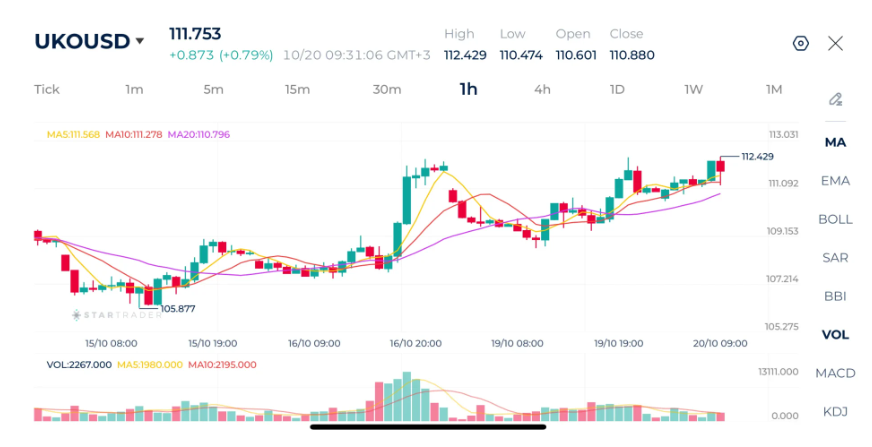
Source: STARTRADER app | Crude brent breaks September’s high on renewed escaltions in the Middle East

Nasdaq Technical Analysis
The Nasdaq 100 is trading at 29,505. After reaching a recent high of 30,051, the index experienced a sharp sell-off, falling to 29,082 before recovering.
The moving averages support this cautious outlook. The bearish alignment of MA(5), MA(10), and MA(20) indicates that short-term momentum remains weak and that the moving averages could act as resistance during any recovery.
Immediate support lies around 29,417, followed by the recent low at 29,082. A break below 29,417 could expose the 29,300 area and potentially lead to a retest of the recent low. On the upside, resistance is located around 29,550–29,580, followed by 29,672. A sustained move above 29,580 would be an initial sign of improving momentum, while a break above 29,672 would strengthen the recovery. Overall, the short-term outlook remains bearish while the index trades below the moving-average cluster.
Nasdaq 1H Chart
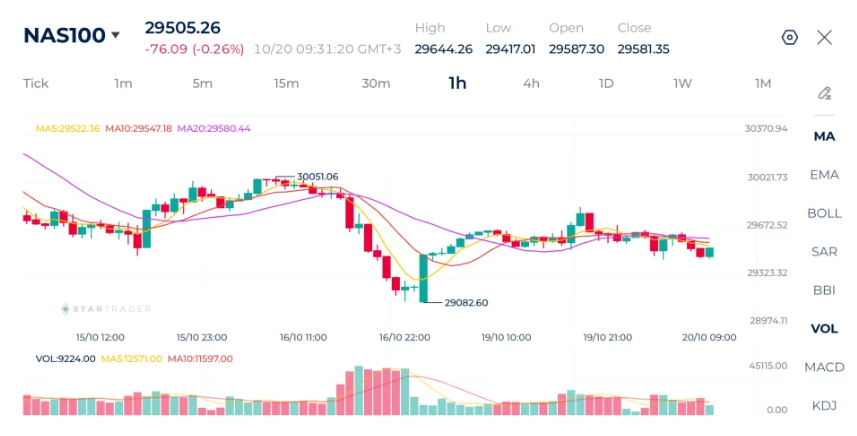
Source: STARTRADER app | Nasdaq attempts to rebound after finding support at the 29,000 level

Risk Disclaimer: This material is provided for informational purposes only and does not constitute a recommendation or investment advice. Trading financial instruments on margin involves substantial risk and may not be appropriate for all investors.


Weekly Market Recap and Forecast: AI Stocks Face Renewed Pressure as Oil Prices Surge, Gold Falls Below $4,100

EURUSD failed to break through the French barrier

Week Ahead – Central bank and earnings bonanza could roil markets

Tech selloff weighs on dollar as Treasury yields tumble

Bitcoin: all eyes on the next move

EBC Markets Briefing | Crude market on a roll as US prepares for new attacks

Brent Crude Climbs Above $114 as US–Iran Tensions Revive