Ethereum's Make-or-Break Moment Is Here

Join Ultima Markets for an in-depth technical analysis of ETHUSD dated January 16, 2026.
Ethereum Traders Are in a Squeeze

The overall bias leans neutral with a tilt towards bullishness, as Ethereum faces a critical juncture on its chart. Following an extended downturn, ETH is now striving to reverse its predominant trend. The price is currently compressed between near-term support and a long-standing resistance barrier. The $3,450 level is decisive: a sustained break above it would verify a shift to a bullish trend, whereas rejection could result in prolonged ranging movement between $2,800 and $3,400.
Key Levels
Resistance
The immediate hurdle is the $3,380-$3,450 zone, a key conflict area that coincides with the 200-day Moving Average and recent highs. A confirmed daily close above this band is essential to signal a true trend reversal. Further up, significant resistance awaits near $3,860—a past consolidation and pivot point. The major psychological barrier remains between $4,900 and $5,000, marking the prior all-time high region.
Support
Initial support rests at $3,150-$3,200, where key moving averages merge. This line is crucial for bulls to maintain if the price is rebuffed by the 200-day MA. The next substantial floor is at $2,800, defined by the late-2025 swing low. The ultimate foundational support lies at $2,450, a historical base established earlier in the year.
Ethereum's Short-Term Signal for a Huge Move
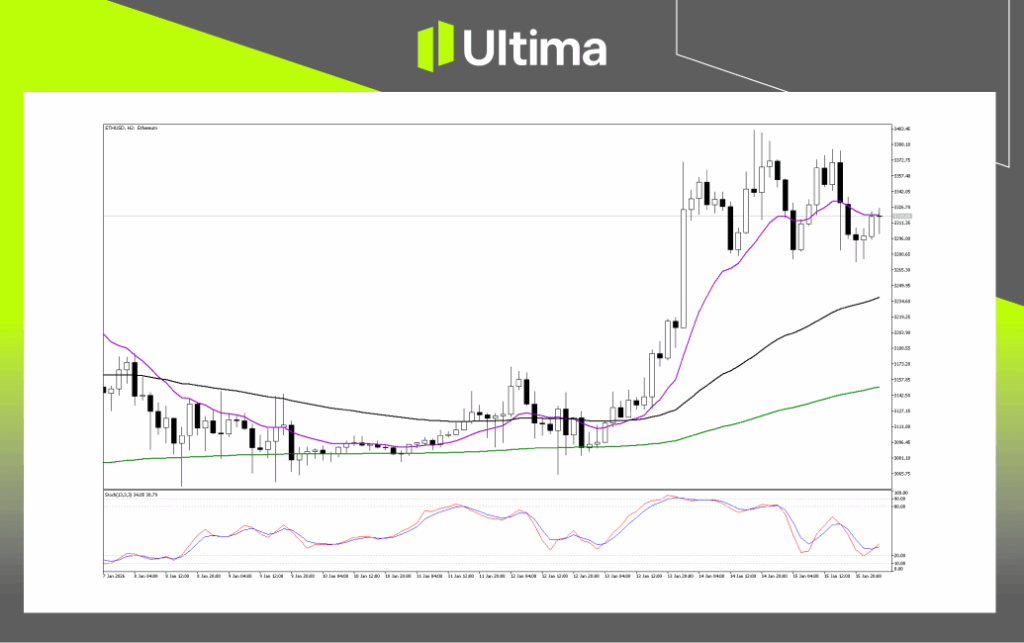
The 2-hour chart indicates a market in consolidation, pausing after recent moves, yet the underlying technical structure continues to appear positive. Tactically, the price is currently ranging within a $3,280 to $3,400 window—a period requiring patience. A clear break above this range would signal the rally resuming, whereas a pullback toward $3,240 could present what many consider a prime "buy the dip" setup.
Potential Breakout Paths
Bullish Scenario
A strong two-hour candle closing above $3,405 would confirm the end of consolidation and likely initiate the next upward leg, targeting at least $3,550.
Bearish Scenario
If price decisively falls below $3,280, a deeper pullback toward the key moving average near $3,240 becomes probable. Importantly, the broader bullish outlook stays valid as long as Ethereum holds above the $3,150 level.
Is Ethereum Trapped?
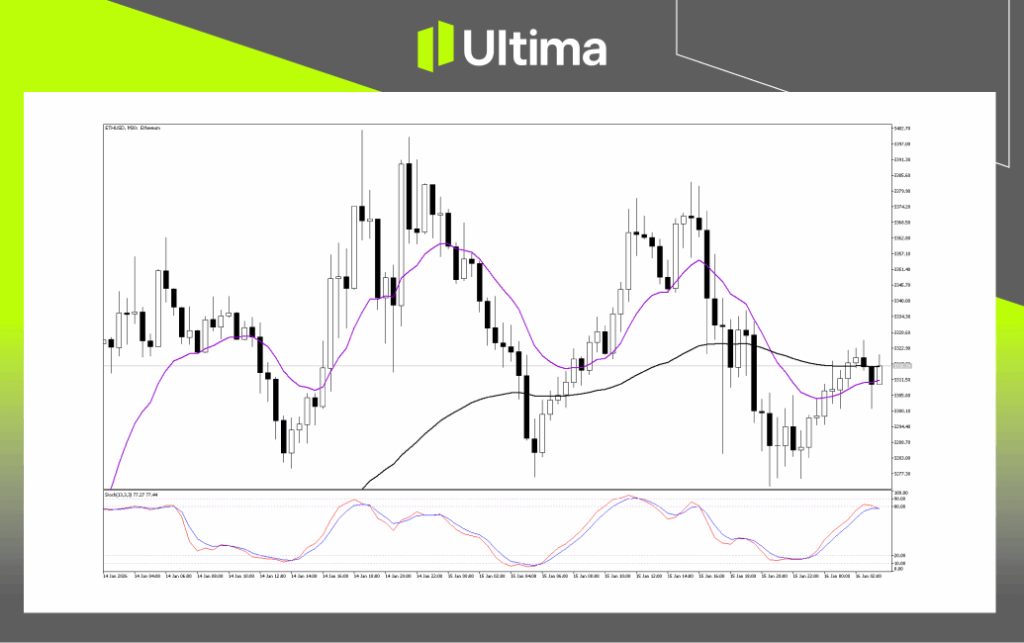
The recent price action shows Ethereum forming successively lower peaks ($3,402 → $3,385 → $3,375 → $3,325), indicating waning buying momentum at higher levels. Currently, the price is wedged between the short-term (purple) and medium-term (black) moving averages. This tight compression often acts as a coiling phase, typically resolved by a sharp "squeeze" and a strong directional move once the price exits this narrow band.
Bearish Breakdown
A break and sustained 30-minute close below $3,280 would signal the start of a deeper pullback. This could trigger liquidations of recent long positions, with a likely target zone of $3,240-$3,250.
Bullish Breakout
Conversely, a decisive move and hold above $3,330 (surpassing the black moving average) would nullify the current selling pressure and pave the way for a retest of the recent highs at $3,375 and $3,402.
Navigating the Forex Market with Ultima Markets
Successfully navigating the complex world of forex, commodities, indices, and shares, it requires staying informed and making data-driven decisions. Ultima Markets is dedicated to providing you with valuable insights to empower your financial journey across all these markets. For personalised guidance tailored to your specific situation, please do not hesitate to contact our team.
Join Ultima Markets today and access a comprehensive trading ecosystem, complete with advanced tools, expert knowledge, and our UM Academy for even more learning. Stay tuned for more updates and analyses from our experts.
—–
Legal Documents
Trading leveraged derivative products carries a high level of risk and may not be suitable for all investors. Leverage can magnify both gains and losses, potentially resulting in rapid and substantial capital loss. Before trading, carefully assess your investment objectives, level of experience, and risk tolerance. If you are uncertain, seek advice from a licensed financial adviser. Leveraged products are not intended for inexperienced investors who do not fully understand the risks or who are unable to bear the possibility of significant losses.
Copyright © 2025 Ultima Markets Ltd. All rights reserved.
Disclaimer
Comments, news, research, analysis, price, and all information contained in the article only serve as general information for readers and do not suggest any advice. Ultima Markets has taken reasonable measures to provide up-to-date information, but cannot guarantee accuracy, and may modify without notice. Ultima Markets will not be responsible for any loss incurred due to the application of the information provided.


Brent has soared above $100. Is this just the beginning?

Today Fundamental Analysis: Brent Holds Around $100 Amid Fresh US-Iran Escalations

S&P 500 Stepped From Record Highs, but Market Breadth Is Flashing a Warning 💥

Bitcoin: the golden cross signals an uptrend, but not right away

US Inflation Data and Elevated Asset Valuations — Nasdaq, S&P 500 and Gold

China50 Tests 14,600 Resistance as Investors Await Inflation Data

Dollar slips, yen surges as Middle East tensions escalate