ETHUSD Trades Above $3,000, Next Move Matters

Ultima Markets Daily Market Insights – January 28, 2026
In today's analysis, Ultima Markets delivers a focused technical breakdown of ETHUSD trading movements.
ETHUSD Daily Chart Insights
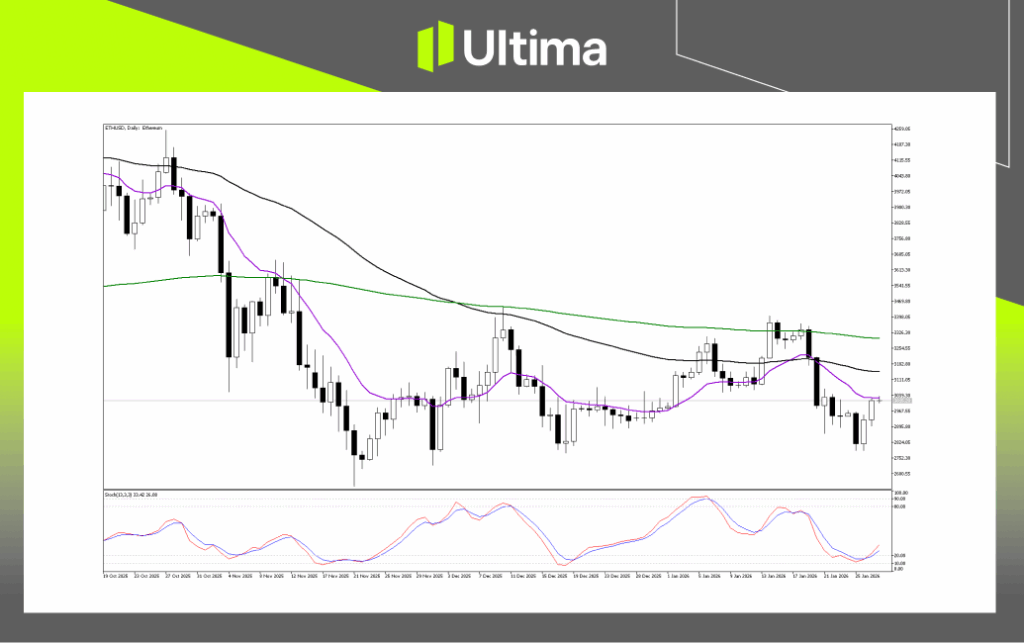
Ethereum remains entrenched in a broader downtrend after topping near $4,100 in October. However, since November 2025, selling pressure has eased into a wide consolidation range, with ETH oscillating between $2,750 and $3,350.
Price has now rebounded from the lower boundary of this range, reclaiming the $3,000 handle and signalling a short term recovery toward the $3,150 - $3,180 zone. Despite this bounce, the medium-term structure stays bearish while ETH trades below the Green long-term moving average near $3,326, keeping upside ambitions capped for now.
Key Levels
Support
The $2,825 - $2,895 region has emerged as a clear demand zone. Multiple long lower wicks printed in late January show buyers consistently stepping in to defend this area. Below that, $2,750 remains the critical structural floor, the true "line in the sand." A breakdown here would invalidate the current consolidation and reopen downside risk.
Resistance
Immediate resistance sits between $3,039 and $3,050, reinforced by the Purple fast moving average and psychological pressure. Above this, $3,180 marks the next hurdle, aligning with the Black medium-term moving average. The most formidable barrier remains the $3,325 - $3,360 zone, where the Green long-term moving average converges with recent swings high, a level ETH failed to clear earlier this month.
ETHUSD 2-Hour Chart Analysis

Short-term movements have clearly shifted in favour of the bulls. Despite stretched movement readings, fading this rally prematurely carries elevated risk. More prudent approaches involve either waiting for a pullback toward $2,955 to confirm support, or watching for a clean breakout above $3,060 to validate further upside continuation.
Breakout Scenarios
Bullish continuation hinges on a decisive 2-hour close above the Green moving average at $3,060. A confirmed break here would likely trigger a swift move into the $3,130 - $3,150 liquidity pocket, driven by the sharp V-shaped recovery structure.
Caution is critical. With Stochastics already overbought and resistance sitting just overhead, a rejection remains plausible. A failure near $3,050 followed by a drop below the Black moving average at $2,955 would suggest the rally lacks depth. Losing $2,955 would turn the move into a potential "dead cat bounce", exposing ETH to renewed pressure toward $2,900 or even a retest of the $2,820 lows.
ETHUSD Pivot Indicator

The short-term trend is clearly pointed higher. Aggressive traders may look for momentum continuation above $3,035, while more conservative participants may prefer waiting for a controlled pullback into the $2,950 - $2,980 zone before committing. Given the strength of the current impulse, attempting to shorten remains a high-risk proposition.
Bullish Continuation
Price action suggests a High Tight Flag formation. In this scenario, ETH consolidates between$3,000 and $3,025 to allow momentum indicators to reset. A confirmed breakout above $3,024 would signal continuation would signal continuation, with upside projections toward $3,080 - $3,100.
Pullback & Retest
If movements cool further, a deeper retracement cannot be ruled out. A loss of Purple moving average near $3,005 could rotate price back toward the $2,950 region, where Green and Black moving averages converge. Such a move would likely represent a constructive pullback rather than trend failure, offering bulls a potential reload zone as long as higher support holds.
Navigating the Forex Market with Ultima Markets
Navigating and trading the forex markets requires clarity, discipline, and access to reliable insights. Ultima Markets is committed to providing data-driven analysis to support informed trading decisions.
Join Ultima Markets today and stay connected with us by following us on social media for the latest news, events, and product updates. Visit UM Academy and access unlimited educational trading resources to help you master the markets.
—–
Legal Documents
Trading leveraged derivative products carries a high level of risk and may not be suitable for all investors. Leverage can magnify both gains and losses, potentially resulting in rapid and substantial capital loss. Before trading, carefully assess your investment objectives, level of experience, and risk tolerance. If you are uncertain, seek advice from a licenced financial adviser. Leveraged products are not intended for inexperienced investors who do not fully understand the risks or who are unable to bear the possibility of significant losses.
Copyright © 2026 Ultima Markets Ltd. All rights reserved.
Disclaimer
Comments, news, research, analysis, price, and all information contained in the article only serve as general information for readers and do not suggest any advice. Ultima Markets has taken reasonable measures to provide up-to-date information, but cannot guarantee accuracy, and may modify without notice. Ultima Markets will not be responsible for any loss incurred due to the application of the information provided.


Brent has soared above $100. Is this just the beginning?
Today Fundamental Analysis: Brent Holds Around $100 Amid Fresh US-Iran Escalations

S&P 500 Stepped From Record Highs, but Market Breadth Is Flashing a Warning 💥

Bitcoin: the golden cross signals an uptrend, but not right away

US Inflation Data and Elevated Asset Valuations — Nasdaq, S&P 500 and Gold

China50 Tests 14,600 Resistance as Investors Await Inflation Data

Dollar slips, yen surges as Middle East tensions escalate