






Nasdaq 100 Tests June Support as Chip Rout Challenges the AI Premium

Summary
- US100 has penetrated the June swing low near 28,565, but the daily breakdown is not confirmed without a closing breach and follow-through.
- Semiconductors and memory-hardware shares are leading the decline as investors reduce crowded exposure to AI infrastructure.
- Technology earnings expectations remain exceptionally high, creating downside asymmetry even when companies beat current-quarter estimates.
- The Iran-US conflict is rebuilding energy and inflation risk, leaving September Fed tightening expectations relevant for long-duration technology valuations.
Market Overview
US100 is undergoing a combined adjustment in positioning, valuation and macro risk. The pressure is mainly in semiconductors, memory and storage, not the whole market. Strong chip earnings have not lifted prices, showing that investors now demand stronger guidance and continued upgrades, not just solid results.
This reflects an expectations issue. IT earnings are expected to grow over 60% year-on-year in Q2, while the S&P 500 is seen above 20%. Much of this growth is already priced in, so the focus has shifted to how sustainable it is, how efficiently capital is used and whether AI spending can keep expanding.
The key risk is slowing growth in hyperscaler capex. Spending may stay high, but if growth slows after 2026, supplier valuations come under pressure. This is driving rotation away from chip and memory stocks toward areas like hyperscalers, software, cybersecurity, healthcare and some financials.
The Iran-US conflict adds inflation risk. Disruptions around the Strait of Hormuz and Red Sea have pushed oil higher, increasing uncertainty around inflation, yields, data-centre costs and consumer demand.
While recent data lowered the chance of a July Fed hike, September remains a risk. If oil stays elevated and short-term yields rise, valuations could compress further even if earnings stay strong.
Fundamental Outlook
US100’s outlook depends on whether strong earnings can offset high valuations and elevated interest rates. Earnings remain robust, with S&P 500 profits expected to rise 23.6% and technology earnings 63.3%, led by semiconductors at 131%. However, expectations are already high, meaning companies must deliver strong results and guidance to sustain momentum.
The key risk lies in slowing AI investment growth. Hyperscaler capex is projected to surge to $673 billion in 2026 but slow sharply afterward, raising concerns for semiconductor demand. Alphabet’s upcoming results will be critical in confirming whether AI spending remains strong.
Recent declines in semiconductor stocks reflect crowded positioning and profit-taking rather than a broad market breakdown. This supports a rotation into less crowded sectors like software, financials, and healthcare.
Valuations remain sensitive to interest rates. With Nasdaq earnings yield near 3.9% and the two-year Treasury around 4.1%, equities face competition from bonds. While near-term Fed hike risks have eased, a rise in yields above 4.20% would pressure tech stocks, while a drop below 4.10% would support them.
Geopolitical risks add uncertainty, with oil near $84 due to Middle East tensions. Sustained higher oil prices could increase costs and inflation, weighing on growth.
Overall, the base case is sector rotation rather than a broad sell-off. Stability depends on continued AI spending, controlled yields, and stable energy prices, while downside risks include weaker capex, rising yields, and persistent inflation pressures.
Technical Analysis
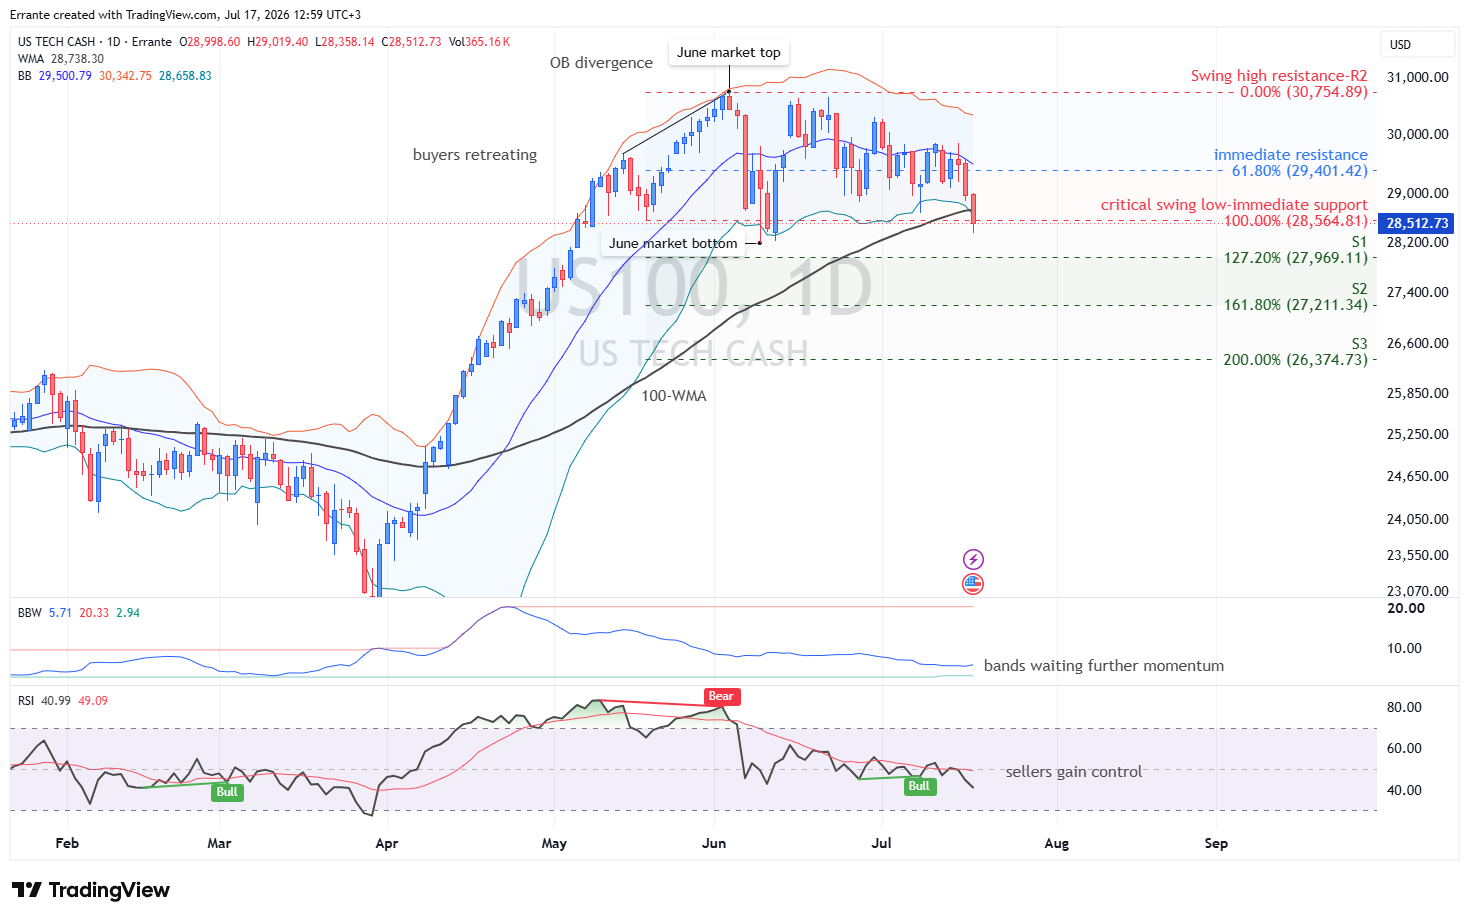
The daily chart shows an established advance from the April low transitioning into a two-month balance between 28,565 and 30,755. This range may represent distribution, but that interpretation requires confirmation. The current candle has traded below the June swing low and the 100-period WMA near 28,738, yet an intraday penetration is not equivalent to an accepted breakdown.
Under classical CMT breakout principles, confirmation requires a decisive daily close below 28,565, preferably accompanied by wider price range, expanding volatility and downside follow-through in the next session. None of those conditions is fully established yet.
The 28,565–28,738 area is therefore the principal decision zone. It combines the June range floor, the 100-period WMA and the lower Bollinger Band near 28,659. A close below the entire cluster would establish a lower low, convert the former support zone into resistance and increase the probability that the balance has resolved lower.
The Bollinger structure currently signals downside extension but not confirmed trend expansion. Price has moved beneath the lower band, yet Bollinger Band Width remains relatively contained. This creates two competing interpretations. Continued closes outside the lower band with rising BBW would confirm volatility expansion. A close back inside the bands and above the WMA would indicate rejection of lower prices and raise the probability of a bear trap.
Momentum deteriorated before price challenged support. RSI formed a bearish divergence against the June market high, showing that the final advance toward 30,755 lacked proportional momentum. RSI is now near 41 and below its signal average, confirming weakening demand.
However, the smaller bullish divergence around the recent lows indicates that downside momentum is not accelerating cleanly. This divergence is only a warning of potential seller exhaustion; it does not become a reversal signal unless price reclaims 28,738 and subsequently produces a higher high above 29,401.
The range also provides a classical measured-move projection. Its approximate height is 2,190 points. Subtracting that distance from the 28,565 floor produces a target near 26,375, which aligns with the 200% Fibonacci extension. Before that level, intermediate supports sit at 27,969 and 27,211.
Key levels:
- Critical decision zone: 28,565–28,738
- First downside support: 27,969
- Secondary support: 27,211
- Measured-move target: 26,375
- Immediate resistance: 28,738
- Major reclaim level: 29,401
- Range resistance: 30,755
Main scenario:
US100 remains under tactical pressure, but the breakdown requires confirmation. A daily close below 28,565, followed by failure to reclaim the level, would complete the range breakdown and expose 27,969, then 27,211. Expanding BBW and RSI remaining below 40 would strengthen this scenario.
Alternative scenario:
An intraday break followed by a daily close back above 28,565–28,738 would indicate rejection of lower prices. Reclaiming 29,401 would confirm a failed breakdown and return the index toward the middle-to-upper portion of the range, with 30,755 becoming relevant again.
The bearish distribution thesis weakens above 29,401 and is invalidated by a sustained daily close above 30,755.
Conclusion
US100 is testing a critical support cluster while the market reassesses the AI investment cycle, earnings expectations and energy-driven Fed risk. The technical structure has deteriorated, but the breakdown remains unconfirmed. The daily close around 28,565–28,738 will determine whether the move becomes a genuine distribution breakdown or another failed attempt below support.


USD/JPY: The Dollar Still Owns the Carry, but Japan Is Starting to Push Back

Gold: Oversold rebound before bears strike again?

Fragile risk appetite as investors prepare for a crucial week

The crypto market is drifting down

The US Midterms Are the Next Test for Gold, the Dollar and Stocks

Five Central Banks Set to Shape Market Sentiment This Week

Week Ahead: Fed Decision, GDP and PCE Inflation Put Dollar, Gold and S&P 500 in Focus