
 (1)-25620261315.jpg)





Today Technical Analysis: Copper breaks a new record high on strong demand

Copper Technical Analysis
Copper shows sustained bullish trajectory as the price has consistently made higher highs and higher lows. After hitting a peak of $6.60 yesterday, the price has entered a minor horizontal consolidation phase.
All three moving averages are sloping upward and are stacked in a bullish alignment, which confirms strong
If Copper breaks and holds above $6.60 with an increase in volume, the next target would likely be the $6.6500 – $6.7000 range.
However, If the price falls below the moving average MA20, the current bullish structure would be compromised, likely leading to a deeper retracement toward the $6.38 support zone seen earlier in the week.
Copper 1H Chart
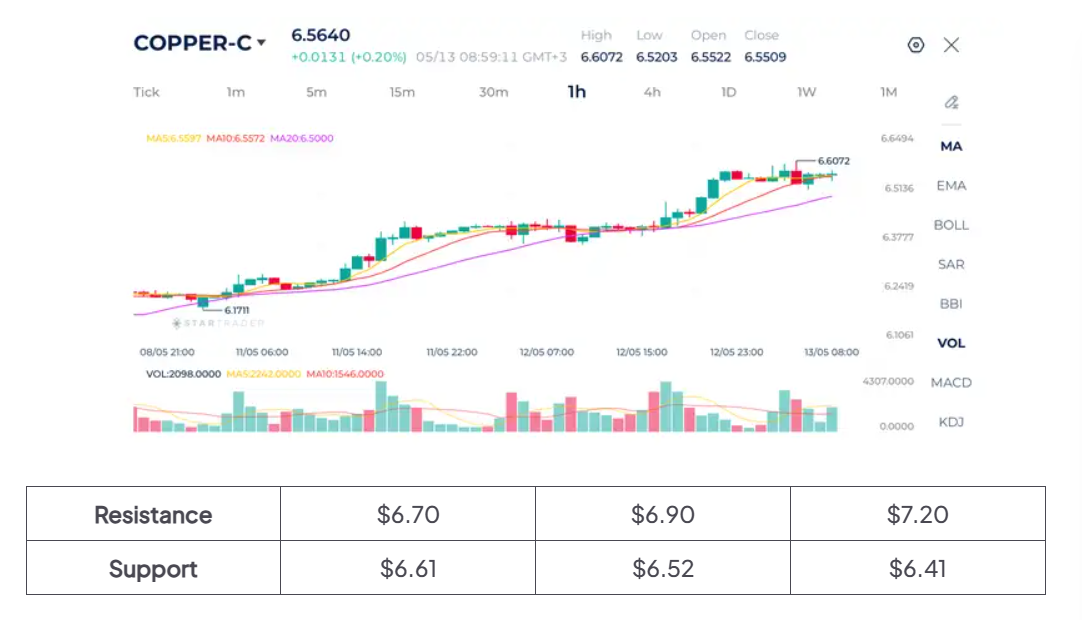
Source: STARTRADER app | Copper reaches a new record high as industrial demand accelerates
Nasdaq Technical Analysis
Nasdaq 100 has regained bullish momentum following a sharp corrective selloff. Buyers stepped back into the market strongly, producing a V-shaped recovery structure and restoring positive short-term sentiment.
Price has reclaimed all key short-term moving averages, with the MA5 crossing above the MA10 and both moving higher above the MA20.
The market is now approaching the key resistance area around 29,240–29,390. A breakout above this resistance cluster would likely confirm continuation of the broader bullish trend and could trigger another expansion higher.
However, traders should still monitor the 29,000–29,050 region carefully. This area now acts as the first major intraday support zone. Holding above it would preserve bullish momentum, while failure below it could trigger another period of consolidation or retracement toward the moving average MA20 near 28,900.
Nasdaq 1H Chart
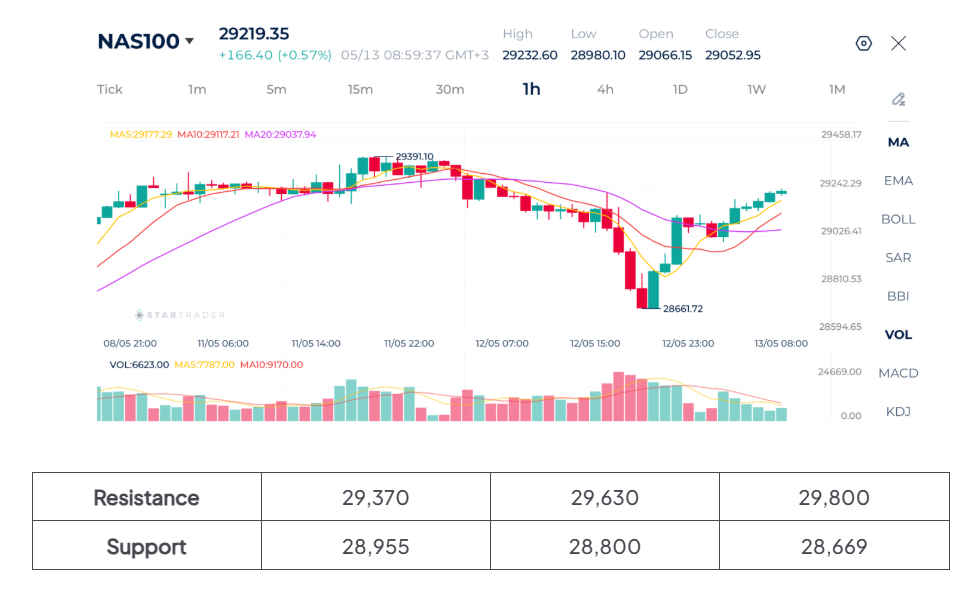
Source: STARTRADER app | Nasdaq 100 recovers following a sharp drop in yesterday's session
Bitcoin Technical Analysis
Bitcoin has started recovering from oversold conditions on the hourly chart in yesterday’s session. The strong reaction from the $79,800 support zone suggests buyers remain active at lower levels. The rebound from that low produced a series of higher lows and allowed price to reclaim both the MA10 and MA20 moving averages, signaling improving short-term sentiment.
The moving average structure is beginning to turn constructive again. The MA5 has crossed back above the MA10, while price is now trading slightly above the MA20 around $80,700–$80,800. This indicates that short-term momentum is recovering after the earlier selloff. However, the recovery still lacks strong impulsive follow-through, meaning buyers have not yet fully regained control.
The $81,150 region is currently acting as immediate resistance. On the downside, the $80,300–$80,000 zone remains the key support cluster. As long as BTC holds above this region, the recovery structure remains intact. A breakdown below $79,800 would invalidate the rebound scenario and likely trigger another bearish leg toward deeper support zones.
Bitcoin 1H Chart
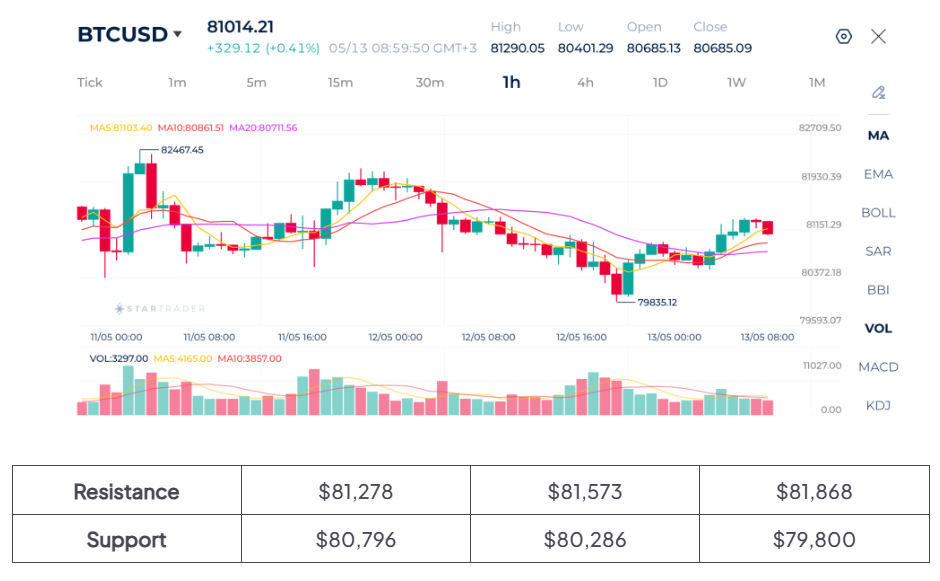
Source: STARTRADER app | Bitcoin rebounds following a strong drop yesterday
AUTHOR
Ghassan Albohtori
Financial Market Analyst - STARTRADER
Ghassan Albohtori is a financial market analyst with experience in macroeconomics, investing, and currency trading. He conducts in-depth market research covering fundamental and technical analysis of different instruments to find major changes in market trends. Mr. Ghassan's main focus is the effects of economic data on different asset classes and how this affects prices.
Risk Disclaimer: This material is provided for informational purposes only and does not constitute a recommendation or investment advice. Trading financial instruments on margin involves substantial risk and may not be appropriate for all investors.


Brent has soared above $100. Is this just the beginning?

Today Fundamental Analysis: Brent Holds Around $100 Amid Fresh US-Iran Escalations

S&P 500 Stepped From Record Highs, but Market Breadth Is Flashing a Warning 💥

Bitcoin: the golden cross signals an uptrend, but not right away

US Inflation Data and Elevated Asset Valuations — Nasdaq, S&P 500 and Gold

China50 Tests 14,600 Resistance as Investors Await Inflation Data

Dollar slips, yen surges as Middle East tensions escalate