
 (1)-25620261315.jpg)





Today Technical Analysis: Dow Jones gains nearly 1% while tech heavy Nasdaq faces selling pressure

Dow Jones Technical Analysis
The Dow Jones continues to trade within a constructive short-term uptrend after recovering from the 51,575 low and pushing back toward the recent high at 52,969. Price remains above the 20-hour moving average, while the 5-hour moving average has crossed back above the 10-hour moving average, indicating that bullish momentum is gradually strengthening after a brief consolidation. The pullback from the recent peak has been relatively shallow, suggesting buyers remain in control.
Immediate resistance is located at 52,970, followed by the psychological 53,100 area. Initial support is seen at 52,685, with stronger support around 52,270, where the 20-hour moving average is currently positioned. A sustained break above 52,970 would confirm bullish continuation and expose fresh record highs, while a move below 52,685 could trigger a deeper correction toward 52,270.
Dow Jones 1H Chart
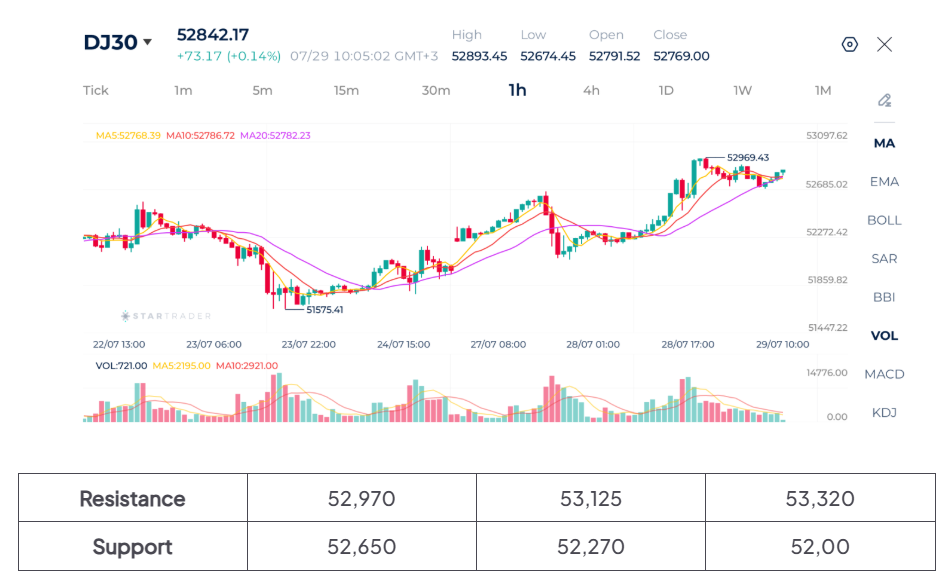
Source: STARTRADER app | Dow Jones advances higher as investors rotate away from AI stocks
Gold Technical Analysis
Gold has staged a modest rebound after holding above the $4,010 support area. Price has moved back above the 5-hour, 10-hour and 20-hour moving averages, with the shorter-term averages turning higher, indicating improving near-term momentum. However, the broader structure still reflects a series of lower highs from the 4,166 peak, meaning confirmation above resistance is required before a stronger bullish reversal can be established.
Immediate resistance is located at 4,045, followed by 4,088. Initial support is seen at 4,030, with stronger support around 4,010. A decisive break above 4,045 would reinforce the recovery and target 4,088, while a move below 4,030 would weaken the bullish outlook and increase the risk of another test of 4,010.
Gold 1H Chart
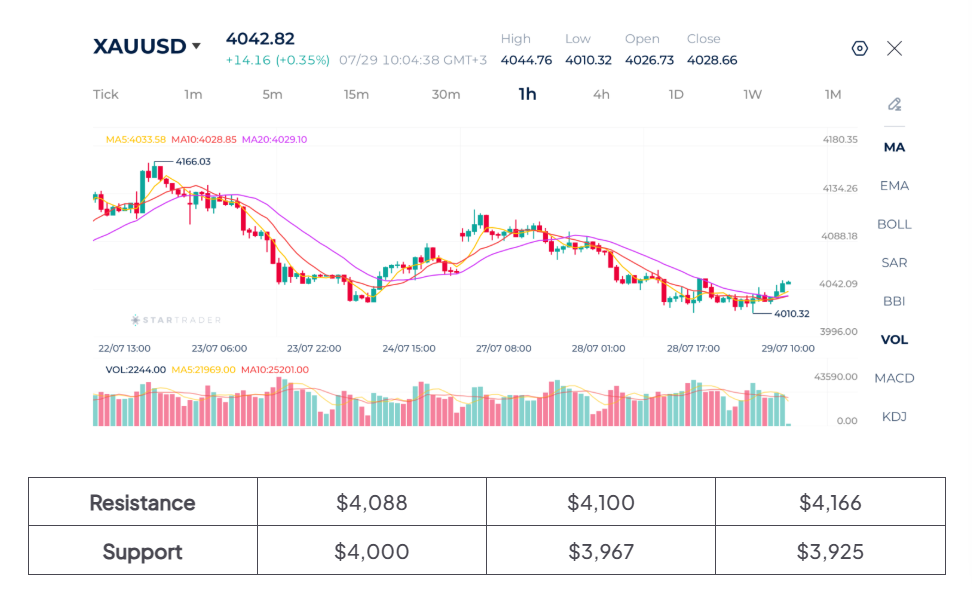
Source: STARTRADER app | Gold finds support around $4,000 psychological level
Brent Technical Analysis
Brent crude is attempting to recover after rebounding from the recent low at $82.79, with prices climbing back above both the 5-hour and 10-hour moving averages. The short-term recovery remains intact; however, the 20-hour moving average continues to slope lower, indicating that the broader trend is still bearish despite the recent rebound. Momentum has improved, but price needs a stronger breakout to confirm a reversal.
Immediate resistance is located at $87.70, followed by $90.30. Initial support is found at $85.85, with stronger support at $82.80. A break above 87.70 would strengthen the recovery and open the door toward $90.30, while failure to hold above $85.85 would suggest the rebound is losing momentum and could expose the recent low once again.
Brent 1H Chart
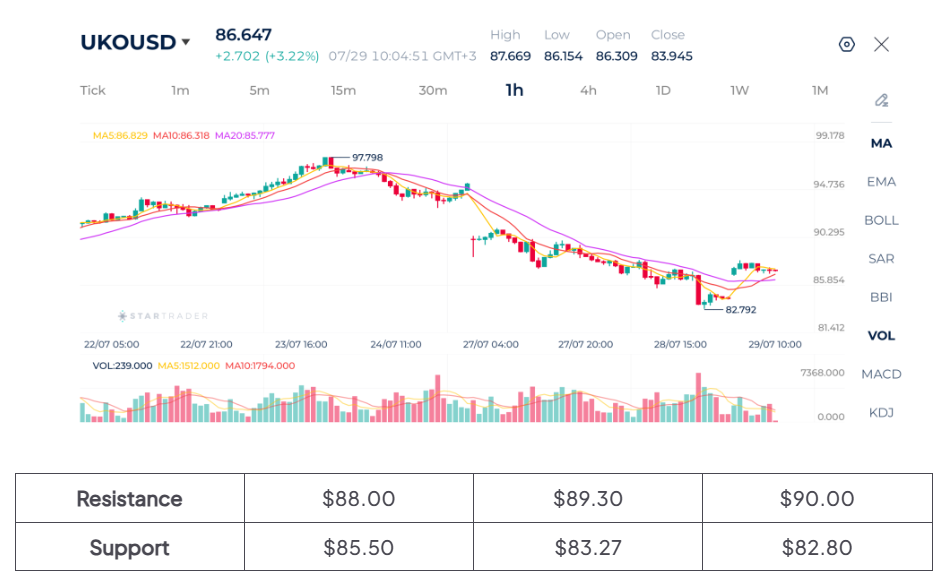
Source: STARTRADER app | Oil prices bounce back as Brent reaches $88
Risk Disclaimer: This material is provided for informational purposes only and does not constitute a recommendation or investment advice. Trading financial instruments on margin involves substantial risk and may not be appropriate for all investors.


Today Fundamental Analysis: Oil Breaks Above $102 as Middle East Tensions Continue to Escalate

Today Technical Analysis: Copper Approaches Record Highs on Surging Demand

Dollar struggles to gain ahead of US inflation data, yen extends rally

EBC Markets Briefing | Crude prices on solid footing amid deep supply concerns

The yen is strengthening before our very eyes

The Inflation Measure Keeping the Fed Cautious

US Yields Rise Despite Buybacks; Eyes on ECB Hike