
 (1)-25620261315.jpg)





Today Technical Analysis: Gold faces resistance around $4,750. Silver settles above $85

Gold Technical Analysis
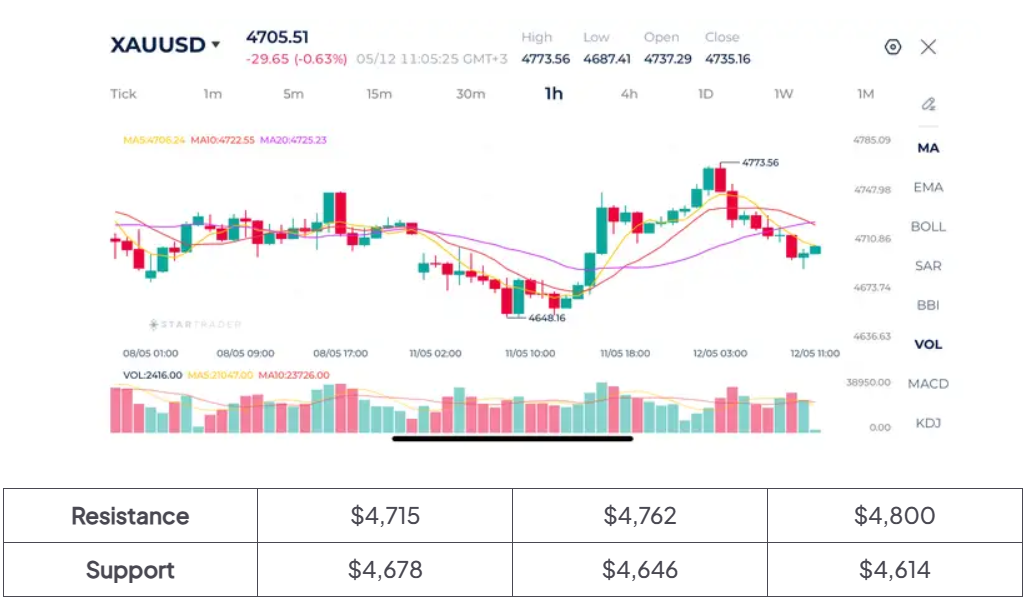
Gold has entered a corrective phase after the strong bullish rally that pushed price toward the $4,773 resistance level. The rally appears to have lost momentum near resistance, leading to profit-taking and renewed selling pressure.
The technical structure currently reflects short term bearish correction. Price has slipped below both the MA5 and MA10 moving averages, while the MA5 has crossed beneath the MA10, confirming weakening momentum. The rejection from $4,773 established a clear resistance ceiling after an extended bullish run.
The $4,680–$4,700 region now becomes the key short-term support zone. If buyers manage to stabilize above this area, gold could attempt another recovery toward $4,735 and potentially retest the $4,773 high. However, continued trading below the MA20 would likely keep pressure on the market and increase the probability of a deeper retracement toward $4,650.
Gold 1H Chart
Source: STARTRADER app | Gold faces resistance at $4,750
Brent Technical Analysis
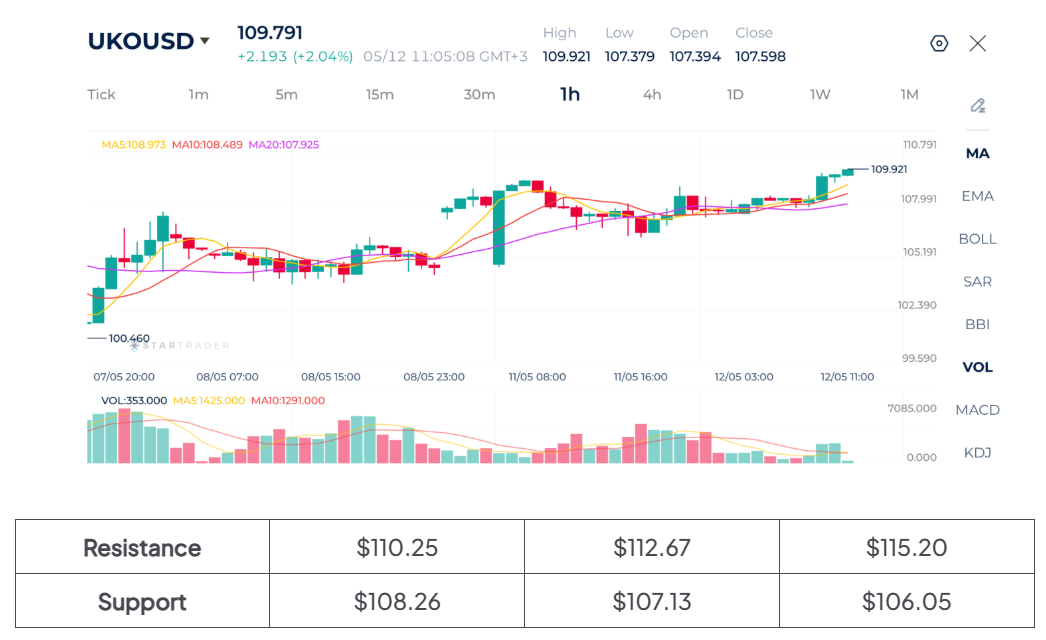
Oil is clearly bullish on the 1-hour timeframe. Crude brent is trading comfortably above the MA5, MA10, and MA20 moving averages.
The breakout above the $107–$108 consolidation region was a major bullish signal because it confirmed continuation of the recovery structure
Momentum is also supported by improving market structure. Pullbacks have remained shallow, and buyers continue to absorb selling pressure quickly whenever the market dips.
If oil successfully breaks above $110 on sustained momentum, the next upside targets could emerge near $112 and potentially $115. On the downside, the first important support zone sits around $107.50–$108.00, followed by stronger support near the MA20 around $106.
Brent 1H Chart
Source: STARTRADER app | Oil remains bullish as it nears the $100 level
Bitcoin Technical Analysis
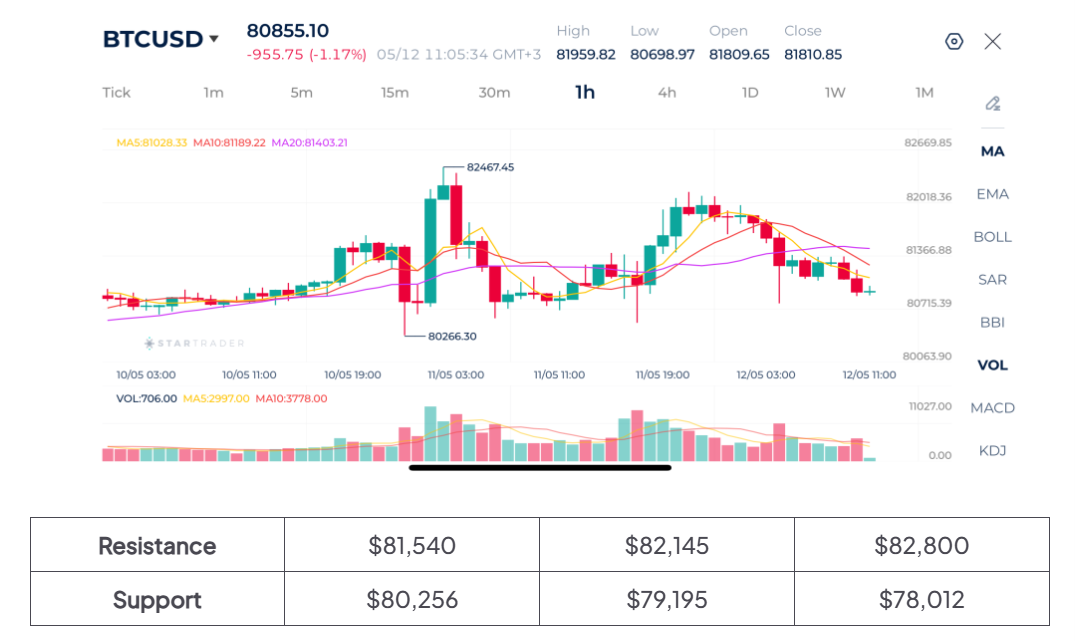
Bitcoin is showing signs of weakening momentum on the hourly chart after failing to sustain the strong bullish breakout that pushed price toward the $82,467 resistance area.
Despite the current pullback, the broader structure remains relatively stable as long as the cryptocurrency holds above the psychological $80,000 support region. This area aligns closely with the recent breakout base and remains critical for bulls. If buyers defend this zone successfully, Bitcoin could stabilize and attempt another move back toward $82,000 and potentially retest the recent highs.
However, if the market breaks below $80,000 decisively, bearish momentum could accelerate toward $79,000 and possibly deeper retracement levels.
Bitcoin 1H Chart
Source: STARTRADER app | Bitcoin finds resistance around the $82,000 level
AUTHOR
Ghassan Albohtori
Financial Market Analyst - STARTRADER
Ghassan Albohtori is a financial market analyst with experience in macroeconomics, investing, and currency trading. He conducts in-depth market research covering fundamental and technical analysis of different instruments to find major changes in market trends. Mr. Ghassan's main focus is the effects of economic data on different asset classes and how this affects prices.
Risk Disclaimer: This material is provided for informational purposes only and does not constitute a recommendation or investment advice. Trading financial instruments on margin involves substantial risk and may not be appropriate for all investors.


Today Fundamental Analysis: Oil Breaks Above $102 as Middle East Tensions Continue to Escalate

Today Technical Analysis: Copper Approaches Record Highs on Surging Demand

Dollar struggles to gain ahead of US inflation data, yen extends rally

EBC Markets Briefing | Crude prices on solid footing amid deep supply concerns

The yen is strengthening before our very eyes

The Inflation Measure Keeping the Fed Cautious

US Yields Rise Despite Buybacks; Eyes on ECB Hike