 (1)-25620261315.jpg)





Today Technical Analysis: Gold falls below $4,400 support level as the selling pressure continues


Gold Technical Analysis
Gold is showing a clear bearish shift on the 1-hour chart after breaking sharply below the previous consolidation range around $4,580–$4,600. The sharp sell-off was accompanied by elevated trading volume, confirming strong selling pressure following Fed chair Warsh speech at the Jackson Hole Symposium.
The moving averages reinforce the bearish setup. The 5-hour and 10-hour moving averages are positioned below the 20-hour MA, while the current price remains below all three averages. The 5-hour MA at around $4,430 is now the first dynamic resistance, followed by the 10-hour MA near $4,442 and the 20-hour MA around $4,489. A sustained recovery above the $4,490 area would be needed to significantly improve the short-term technical picture. On the downside, $4,396 represents the immediate support, with a break below this level potentially opening the way toward the $4,350 and $4,300 areas. For now, the bias remains bearish as long as gold trades below $4,450–$4,490.
Gold 1H Chart
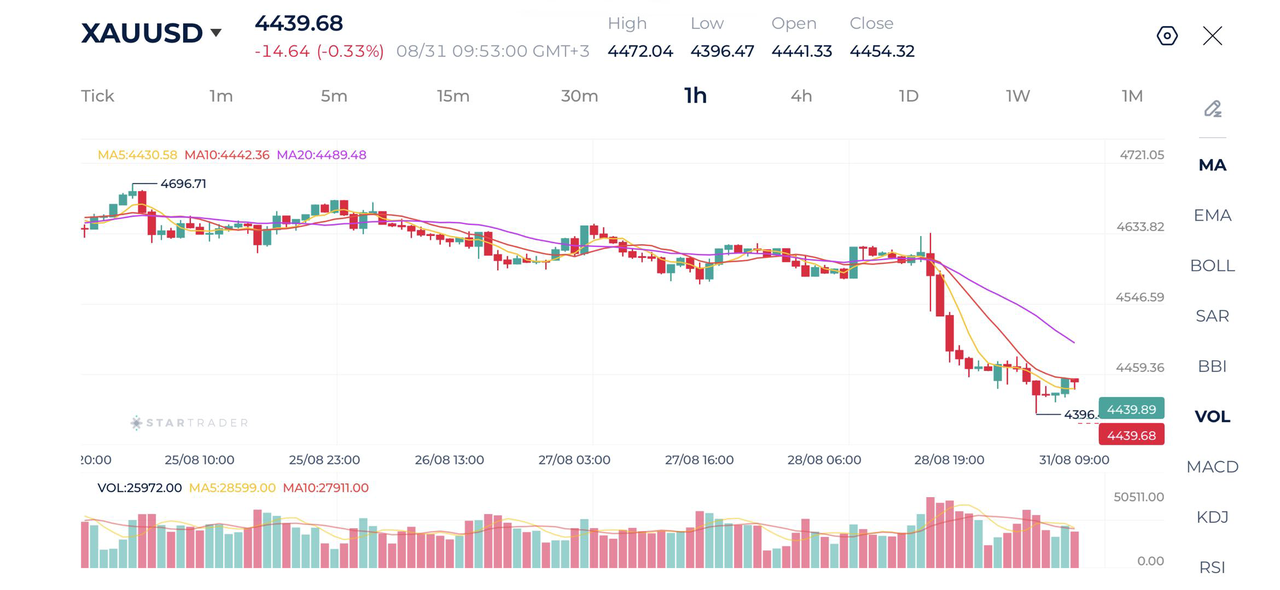
Source: STARTRADER app | Gold falls below $4,400 after Fed chair Warsh hints at rate hike

Brent Technical Analysis
Brent crude oil has strengthened considerably on the 1-hour chart, with price climbing to around $91.93 after breaking above the $90.00 level. The chart shows a clear transition from consolidation around $90 to a stronger upside move, with several consecutive bullish candles pushing the market toward the $92 area. The move has also been supported by an increase in trading volume, adding credibility to the latest breakout. However, the small pullback visible around the current price suggests that some profit-taking may be emerging after the sharp advance.
The moving averages remain firmly bullish. Price remains above all three averages MA(5), MA(10), and MA(20), indicating that the short-term trend continues to favor buyers. The $91.30–$91.75 region now provides the first layer of dynamic support, while $90.40–$90.50 represents a more important support zone around the 20-hour MA. On the upside, $92.40 is the immediate resistance, followed by the recent broader high around $93.78. As long as Brent holds above $90, the technical outlook remains bullish, with a break above $92.40 potentially opening the door toward $93.80.
Brent 1H Chart
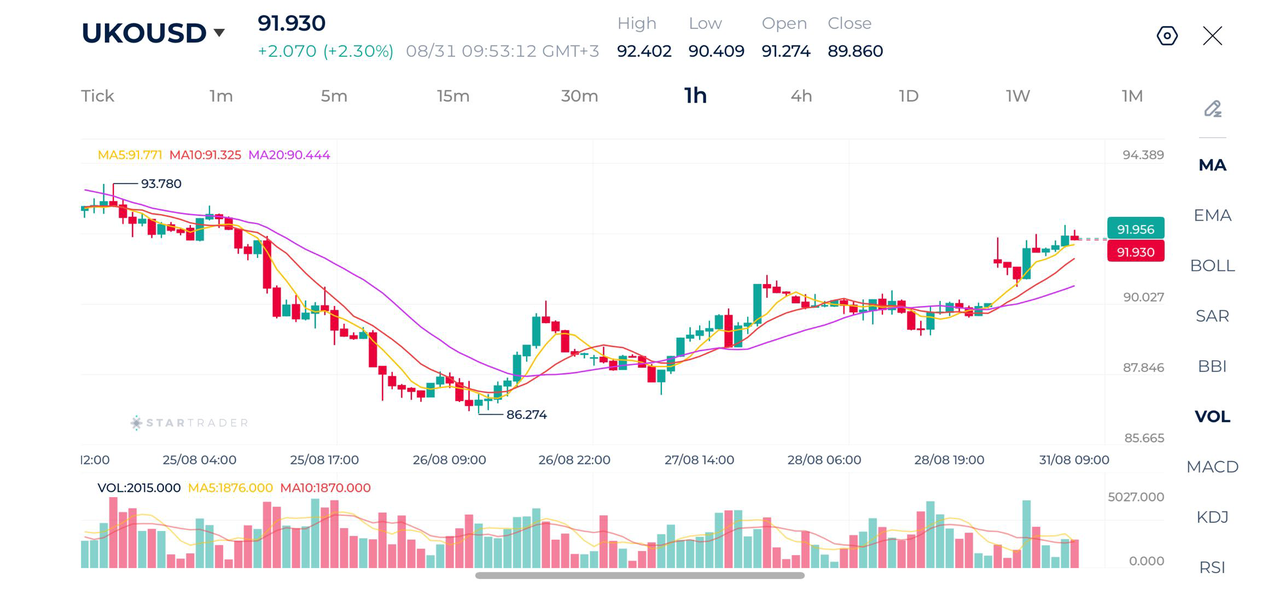
Source: STARTRADER app | Oil prices open higher as tensions between the US and Iran escalate again

USDJPY Technical Analysis
USDJPY remains in a broader bullish structure on the 1-hour chart, although the pair is currently undergoing a short-term correction after reaching a recent high of 160.20. The pair had been steadily advancing from the 158.87 area and accelerated sharply toward 160, but encountered resistance near the psychological 160.00 level. The subsequent pullback brought the pair toward 159.70 before it stabilized and began attempting a modest recovery.
The moving averages are still relatively supportive, with the 5-hour MA at 159.804, the 10-hour MA at 159.912 and the 20-hour MA at 159.923. Price is currently trading slightly below the three averages, suggesting that short-term momentum has weakened, although the broader structure has not yet turned decisively bearish. The 159.70–159.75 zone is an important near-term support area, while a break below 159.53 could signal a deeper correction toward 159.15. On the upside, the first resistance is around 160.00–160.20, with a sustained break above 160.20 potentially extending the bullish move. Overall, the bias remains cautiously bullish above 159.50, but momentum needs to recover above the moving-average cluster.
USDJPY 1H Chart
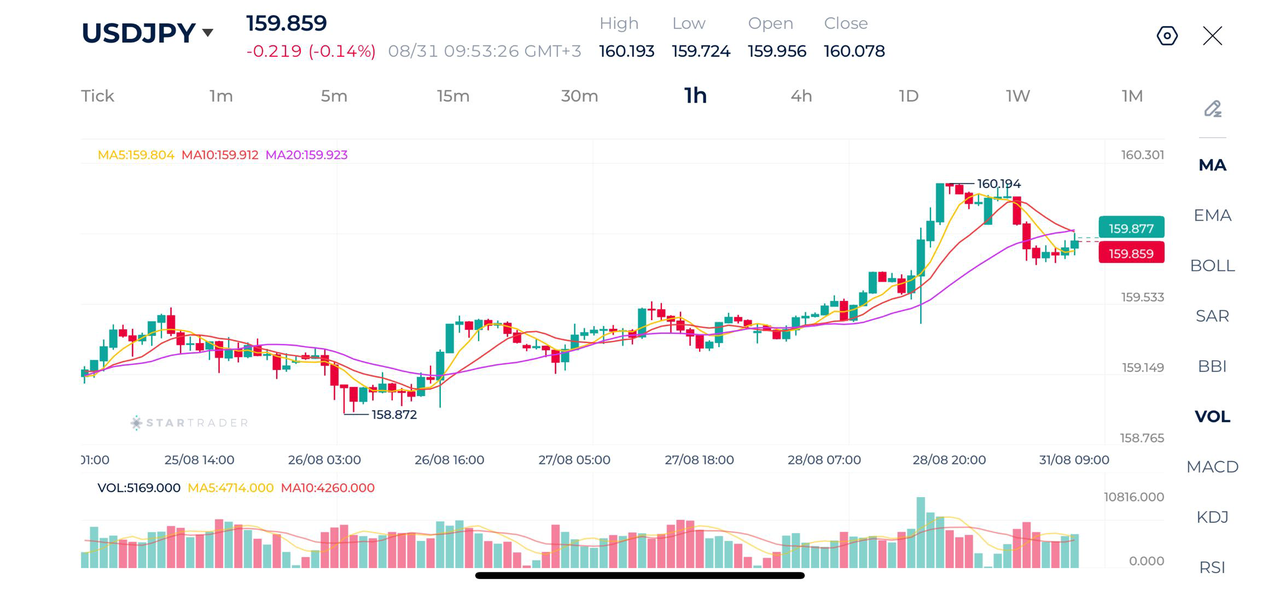
Source: STARTRADER app | USDJPY rises back above critical 160.00 level on hawkish remarks from Fed chair Warsh

Risk Disclaimer: This material is provided for informational purposes only and does not constitute a recommendation or investment advice. Trading financial instruments on margin involves substantial risk and may not be appropriate for all investors.


US Midterms: Early Democratic Senate Wins Sink Dollar and Drag Futures Lower

RBA’s Split Rate Hike and US Midterm Uncertainty Shape Currency Markets | 3rd November, 2026

Central Bank Signals and Easing Safe-Haven Demand Shape Currency Markets | 2nd November, 2026

BoJ Hawkish Hold and a Softer US Dollar Shape Currency Markets | 30th October, 2026

The ECB, the Bank of Japan and the Fed prefer to wait until December

Fed Holds Rates; PCE and ECB Take Center Stage

Rate-Hike Bets and a Hawkish Fed Hold Shape Currency Markets | 29th October, 2026