
 (1)-25620261315.jpg)





Today Technical Analysis: Gold jumps 1.5% as the US dollar index falls below 100 level

S&P 500 Technical Analysis
The S&P 500 remains in a clear uptrend after extending its rally to fresh record highs. The index is trading comfortably above the 5, 10 and 20-period moving averages, which are all sloping upward, confirming strong bullish momentum and continued buyer control.
Despite the strength of the trend, the sharp advance has pushed the index into overextended territory, increasing the likelihood of short-term consolidation or profit-taking before another move higher. As long as prices remain above the rising moving averages, any pullback is likely to face strong support.
S&P 500 1H Chart
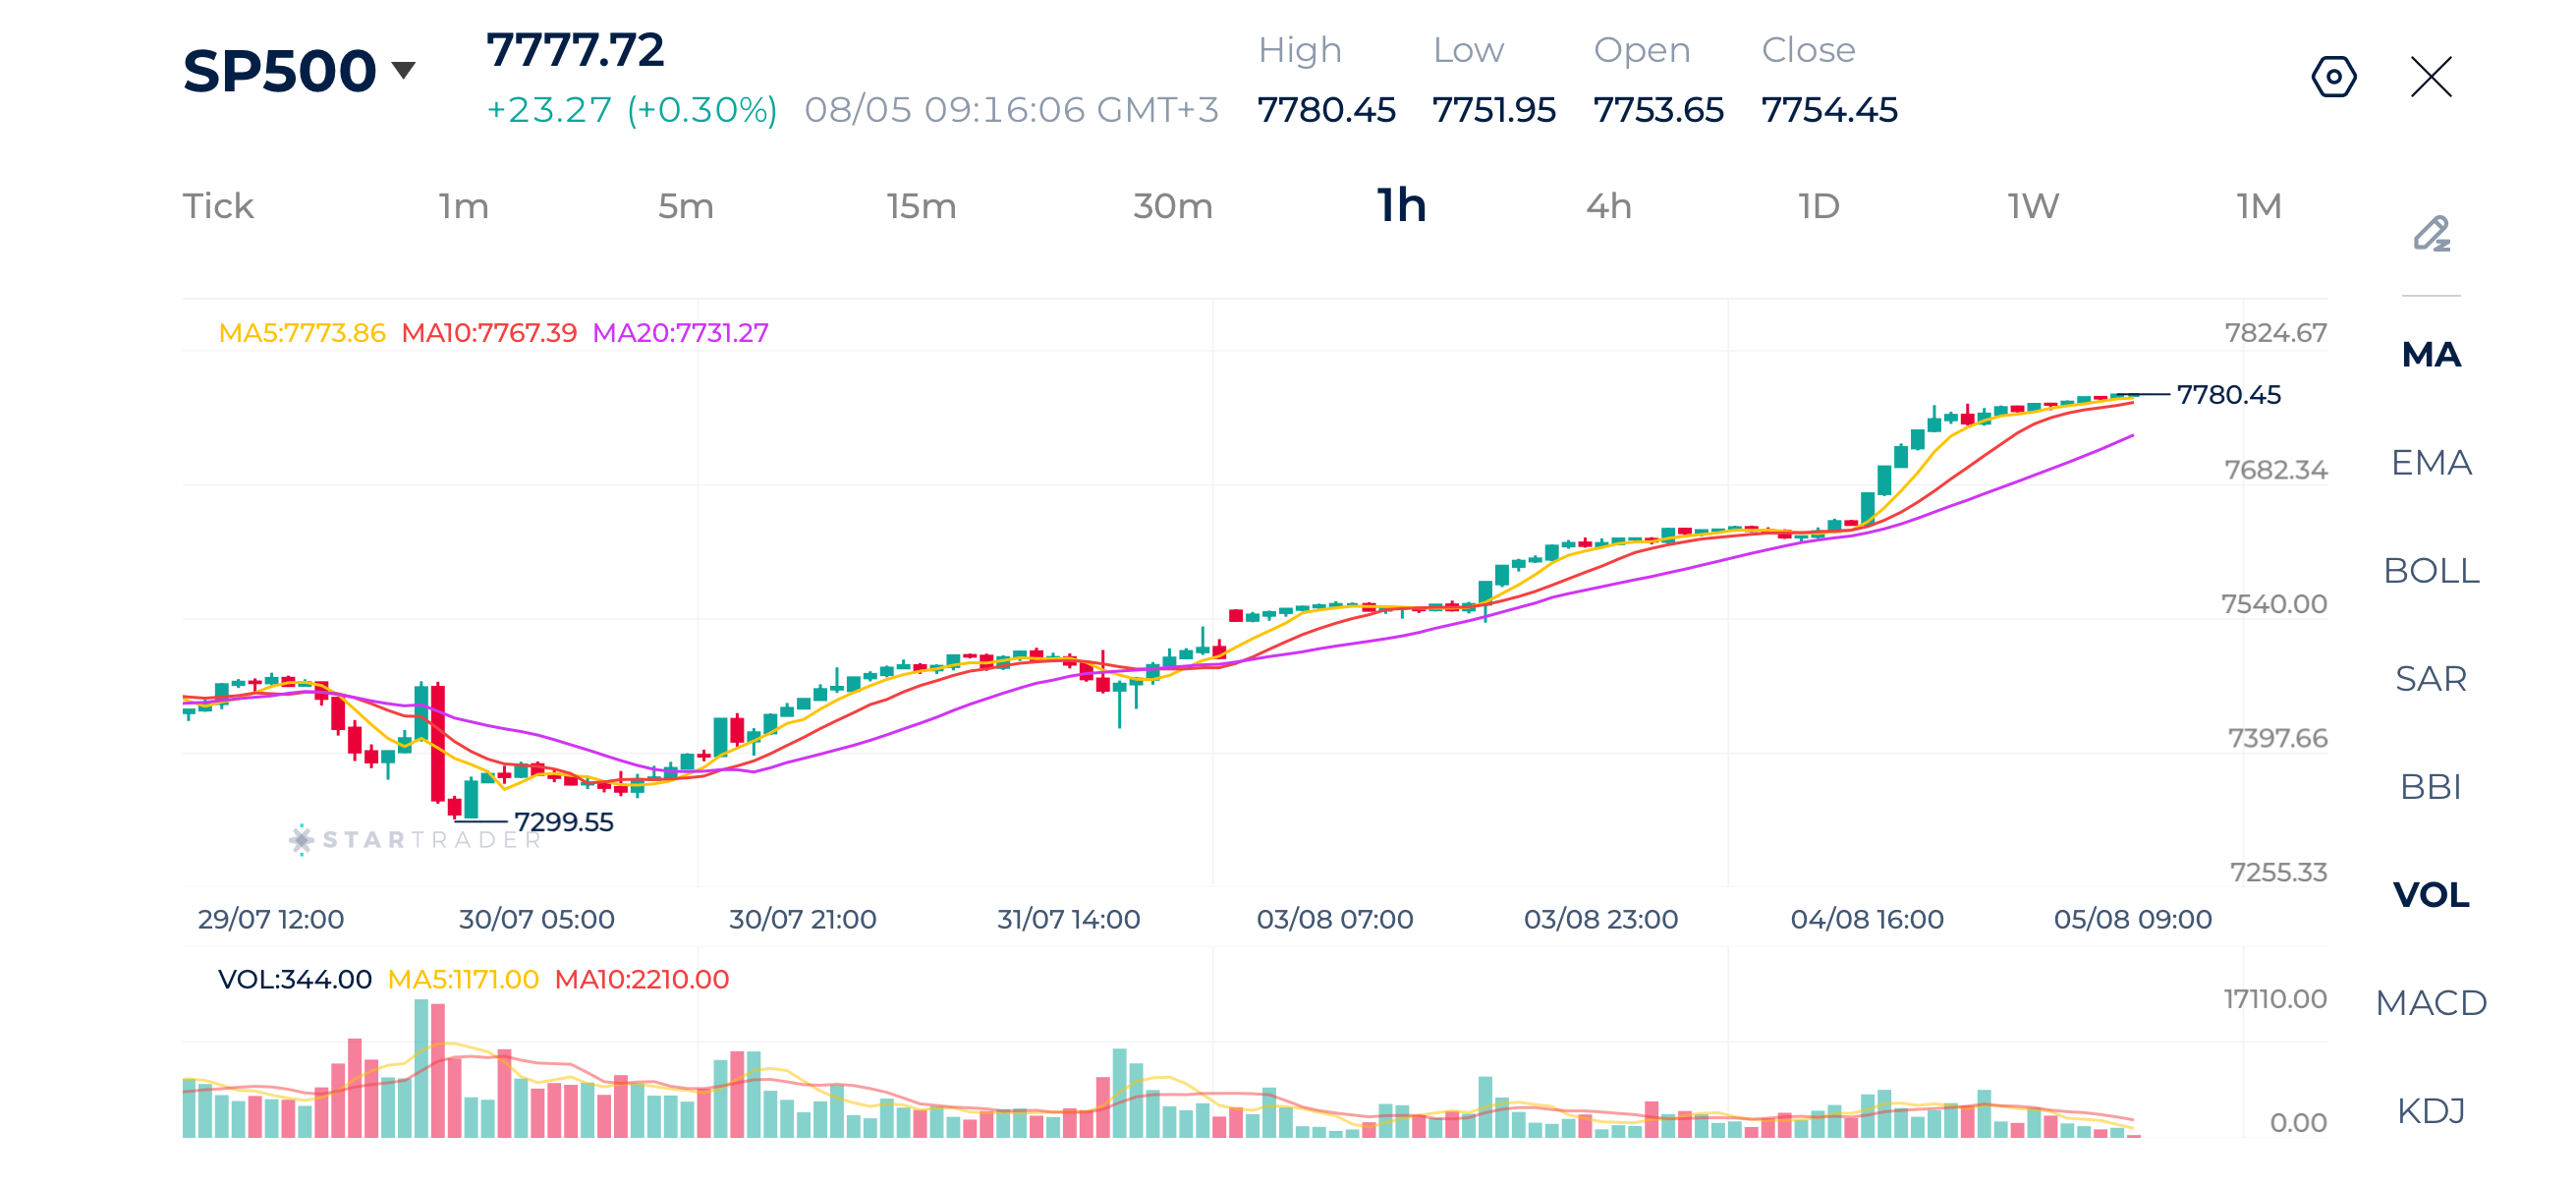
| Resistance | 7,780 | 7,800 | 7,824 |
| Support | 7,734 | 7,700 | 7,620 |
Source: STARTRADER app | S&P 500 breaks a new record high above 7,700 for the first time
Gold Technical Analysis
Gold has staged a strong bullish breakout after clearing a prolonged consolidation range, with buying momentum accelerating sharply during the latest session. Price is trading well above all major short-term moving averages, while the widening gap between the averages reflects increasing upside momentum.
The breakout is supported by strong bullish candles, suggesting buyers remain firmly in control. However, after such a rapid advance, the market may experience a brief pullback or consolidation before attempting another move higher. Holding above the breakout zone would reinforce the positive outlook and keep the broader uptrend intact.
Gold 1H Chart
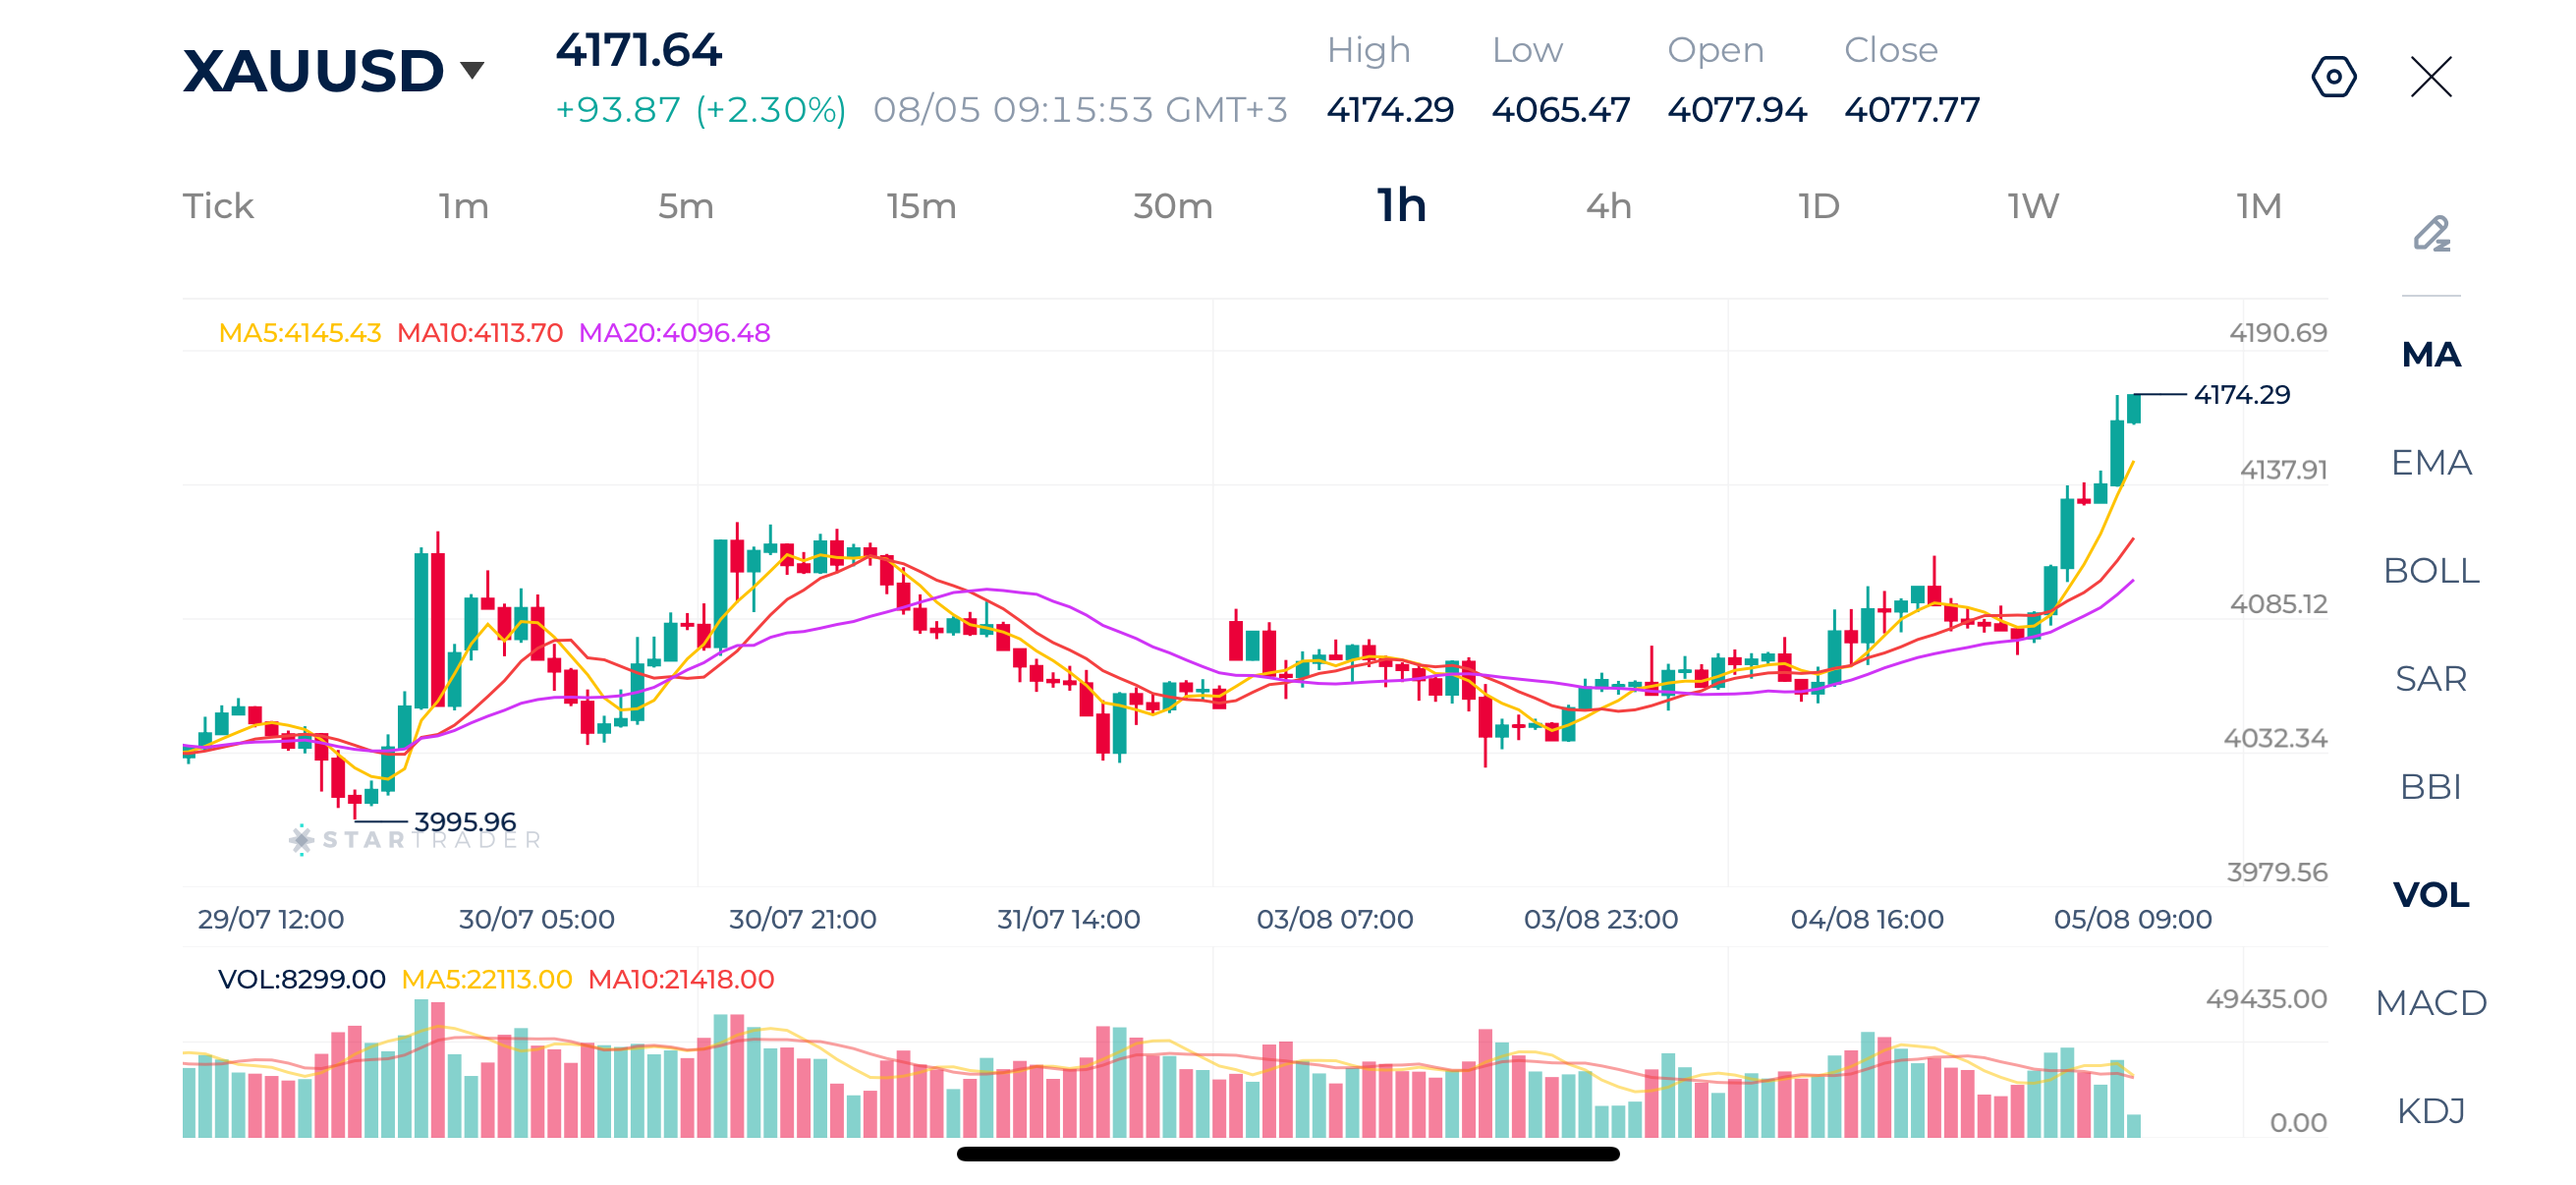
| Resistance | $4,175 | $4,200 | $4,274 |
| Support | $4,135 | $4,105 | $4,085 |
Source: STARTRADER app | Gold jumps 1.5% as the US dollar slightly weakens
USDJPY Technical Analysis
USDJPY is trading in a narrow consolidation after recovering from recent weakness, with price holding above the 20-period moving average, while the 5 and 10-period averages have started to turn higher. The alignment of the moving averages suggests that short-term bullish momentum is gradually improving, although the lack of strong follow-through indicates buyers remain cautious.
The pair continues to respect a series of higher lows, suggesting underlying demand remains intact. A sustained move above the recent swing high near 157.95 could encourage another leg higher, while failure to maintain support around the moving averages may trigger renewed decline toward the 157.10–157.30 area.
USDJPY 1H Chart
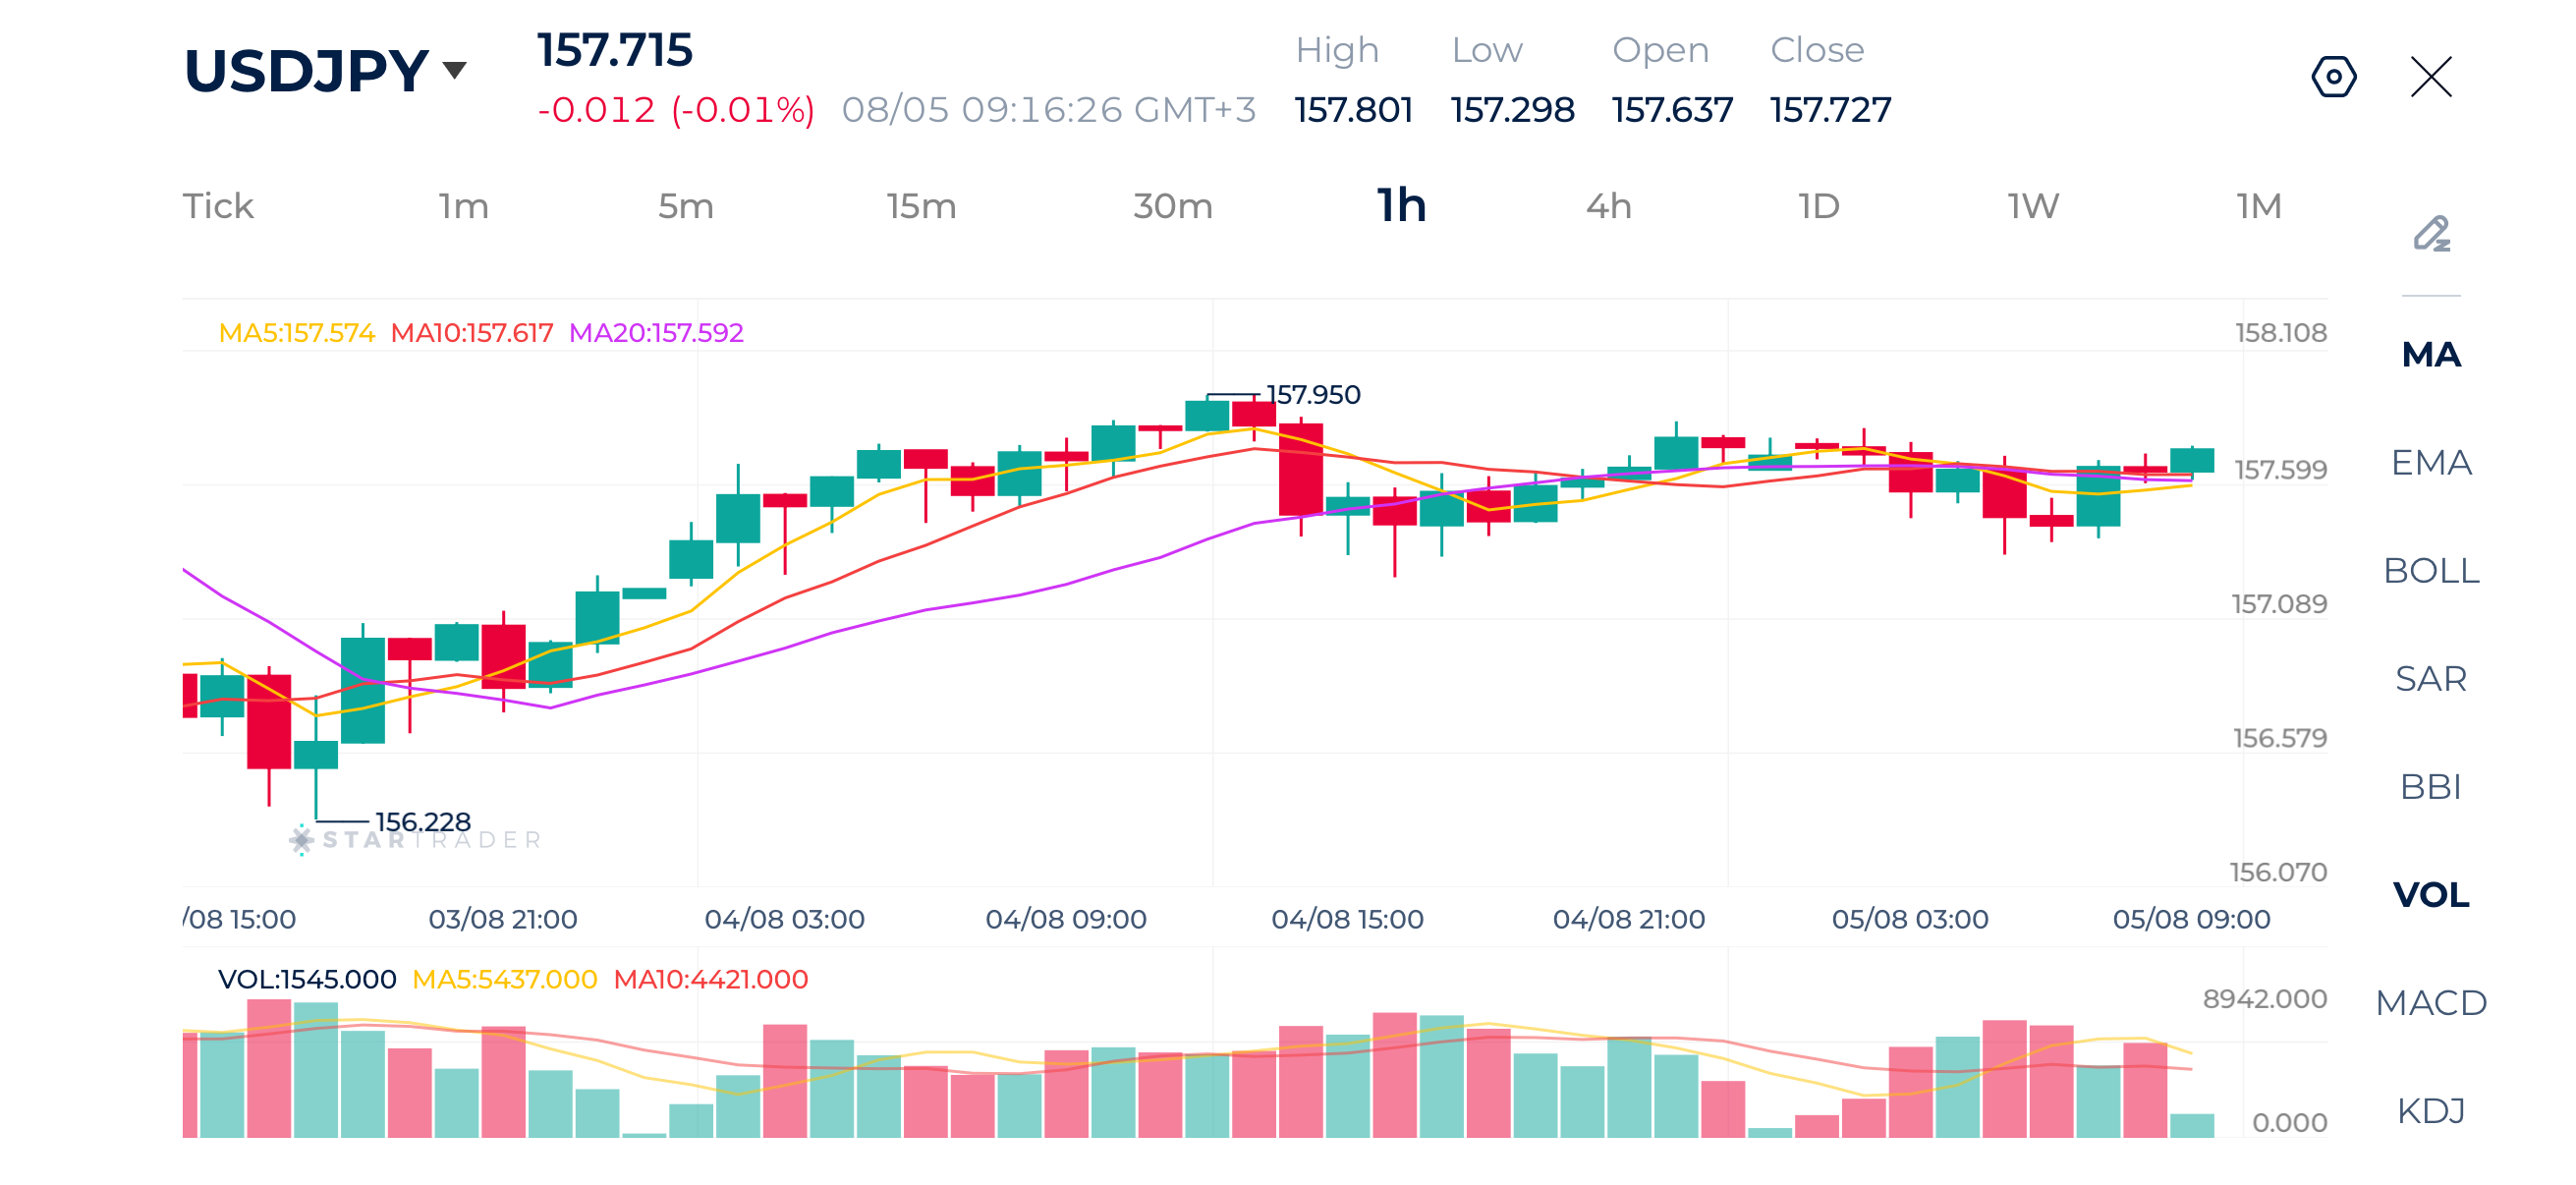
| Resistance | 158.00 | 158.50 | 159.54 |
| Support | 157.22 | 156.60 | 156.20 |
Source: STARTRADER app | USDJPY holds above 157.00, but continues in range trading
Risk Disclaimer: This material is provided for informational purposes only and does not constitute a recommendation or investment advice. Trading financial instruments on margin involves substantial risk and may not be appropriate for all investors.


The yen is strengthening before our very eyes

US Yields Rise Despite Buybacks; Eyes on ECB Hike

Today Fundamental Analysis: Brent Holds Around $100 Amid Fresh US-Iran Escalations

Today Technical Analysis: Japanese Yen Hits Highest Level Against the Dollar Since February

Yen Hits 6-Month High, Volatility Returns After North American Holiday.

USD/JPY Falls Below 154.000 as BOJ Rate Hike Bets Support Yen

USDJPY hits 7-month lows: recovery or bear trap?