
 (1)-25620261315.jpg)





Today Technical Analysis: Gold jumps above $4,300 an ounce as the US dollar remains relatively weak

Brent Technical Analysis
Brent crude has stabilized after a sharp selloff, with price entering a period of sideways consolidation around the $81.30 area. The short-term moving averages have flattened and converged with the 20-period moving average, signaling that bearish momentum has faded while buyers and sellers remain evenly matched.
Although the recent rebound suggests selling pressure is easing, the market has yet to establish a convincing series of higher highs that would confirm a sustained recovery. A break above the recent consolidation range would strengthen the case for a broader rebound, while a failure to hold above the $81.00 region could expose the market to another wave of selling toward recent lows.
Brent 1H Chart
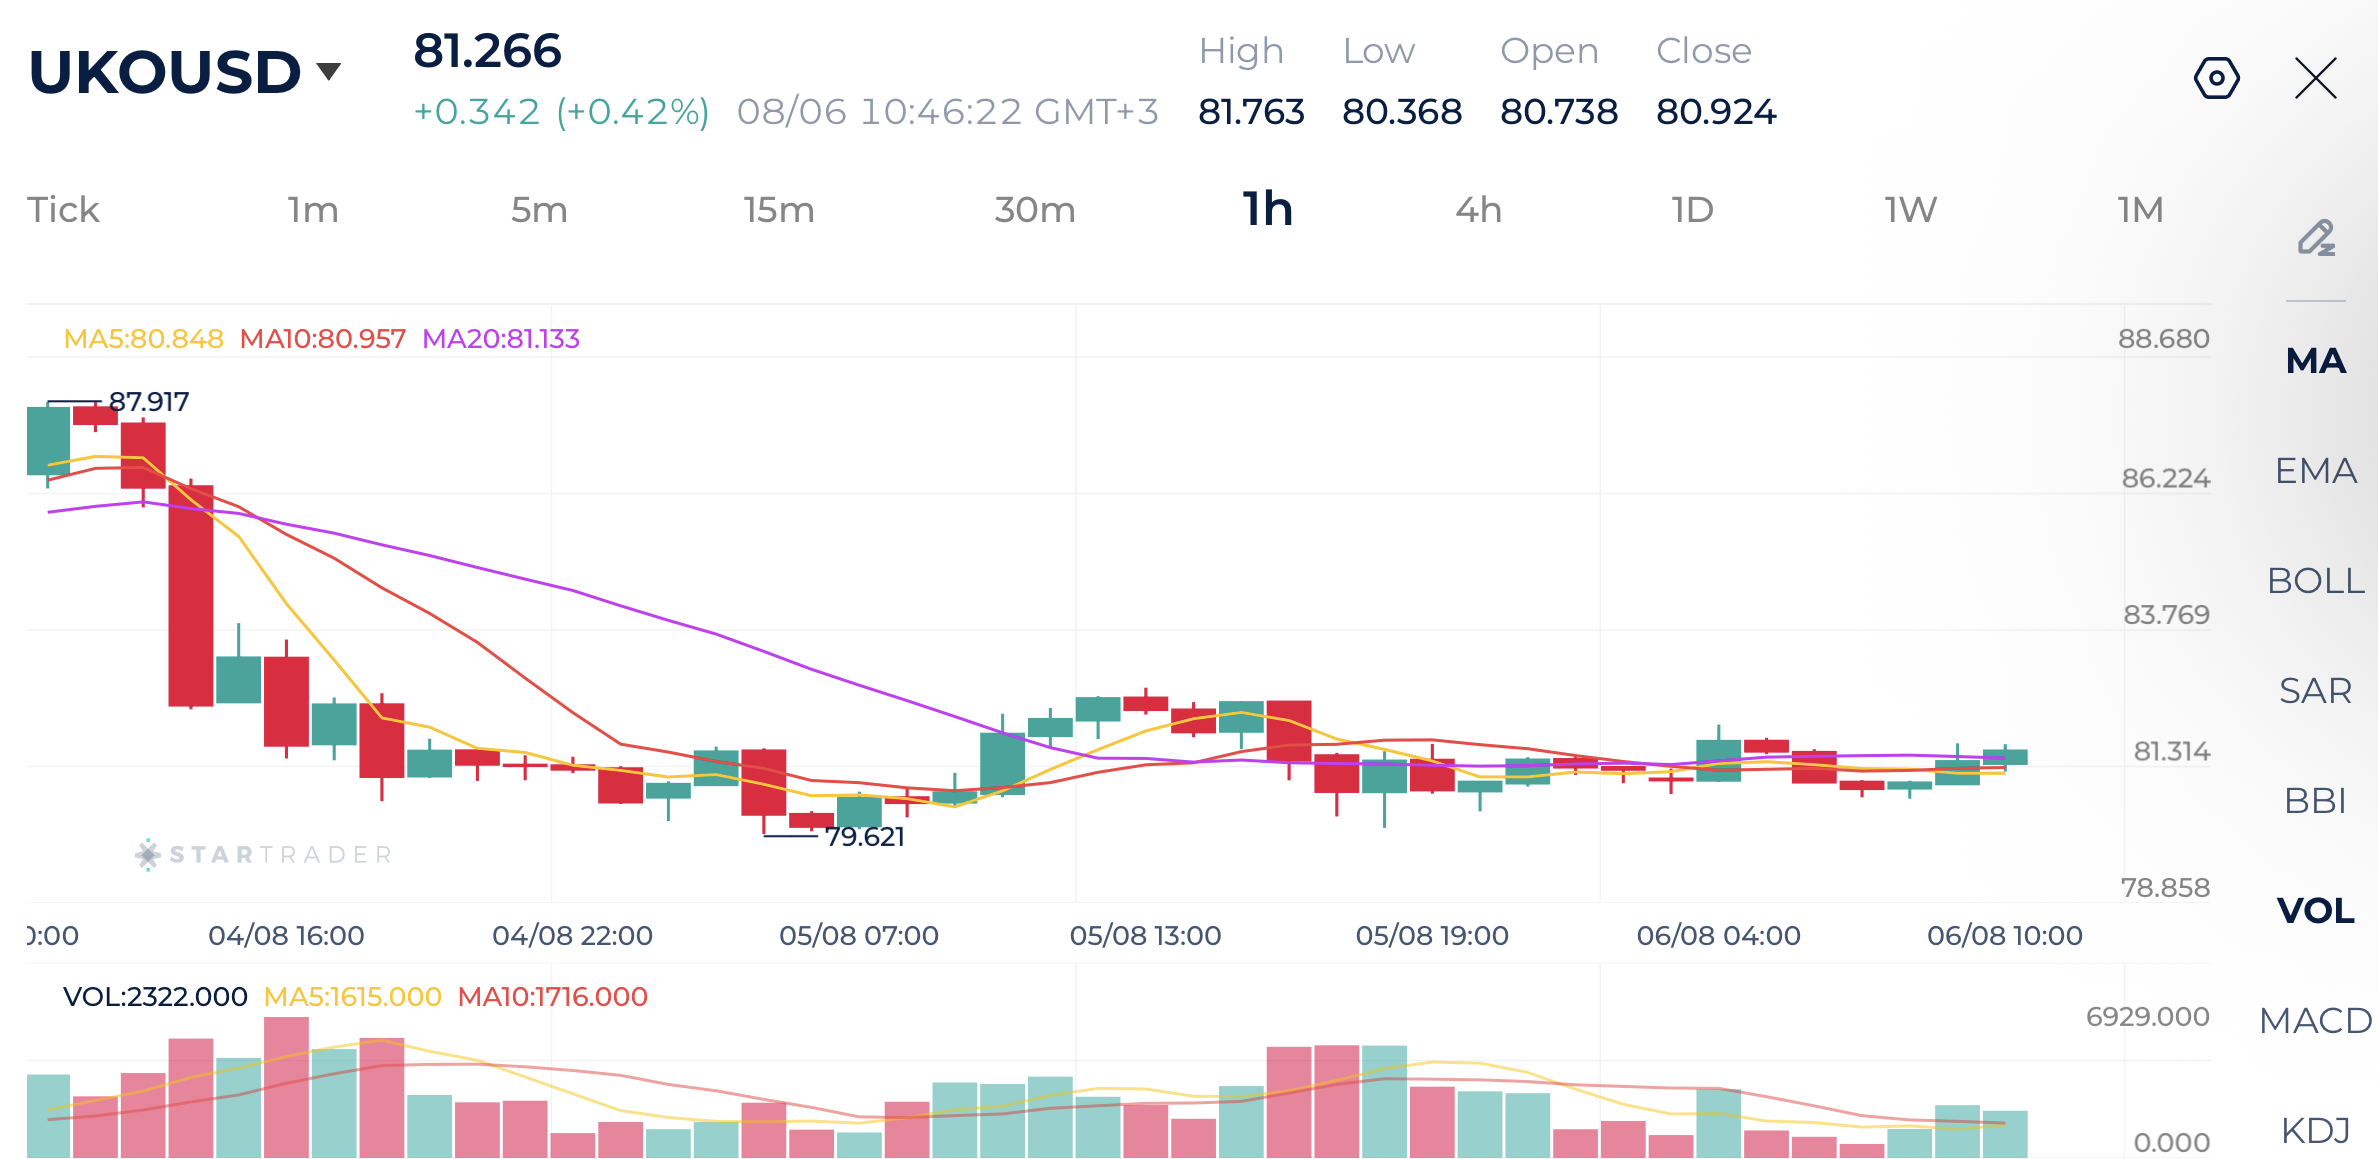
Source: STARTRADER app | Crude brent stabilizes around $80 levels
| Resistance | $82.20 | $83.00 | $84.56 |
| Support | $80.35 | $79.60 | $78.44 |
Gold Technical Analysis
Gold remains in a strong short-term uptrend despite the recent pullback from its session high near $4,304. The precious metal continues to trade above the rising 20-period moving average, while the 5 and 10-period moving averages have started to flatten, indicating that bullish momentum is cooling. The overall moving average structure remains constructive, suggesting buyers still have the upper hand.
The latest decline appears to be a healthy consolidation following an aggressive rally. As long as prices hold above the 20-period moving average and the recent breakout zone around $4,245–$4,250, buyers are likely to defend the trend. A break above $4,304 would confirm the resumption of the broader bullish move, while a sustained drop below the 20-period average could trigger a deeper correction.
Gold 1H Chart
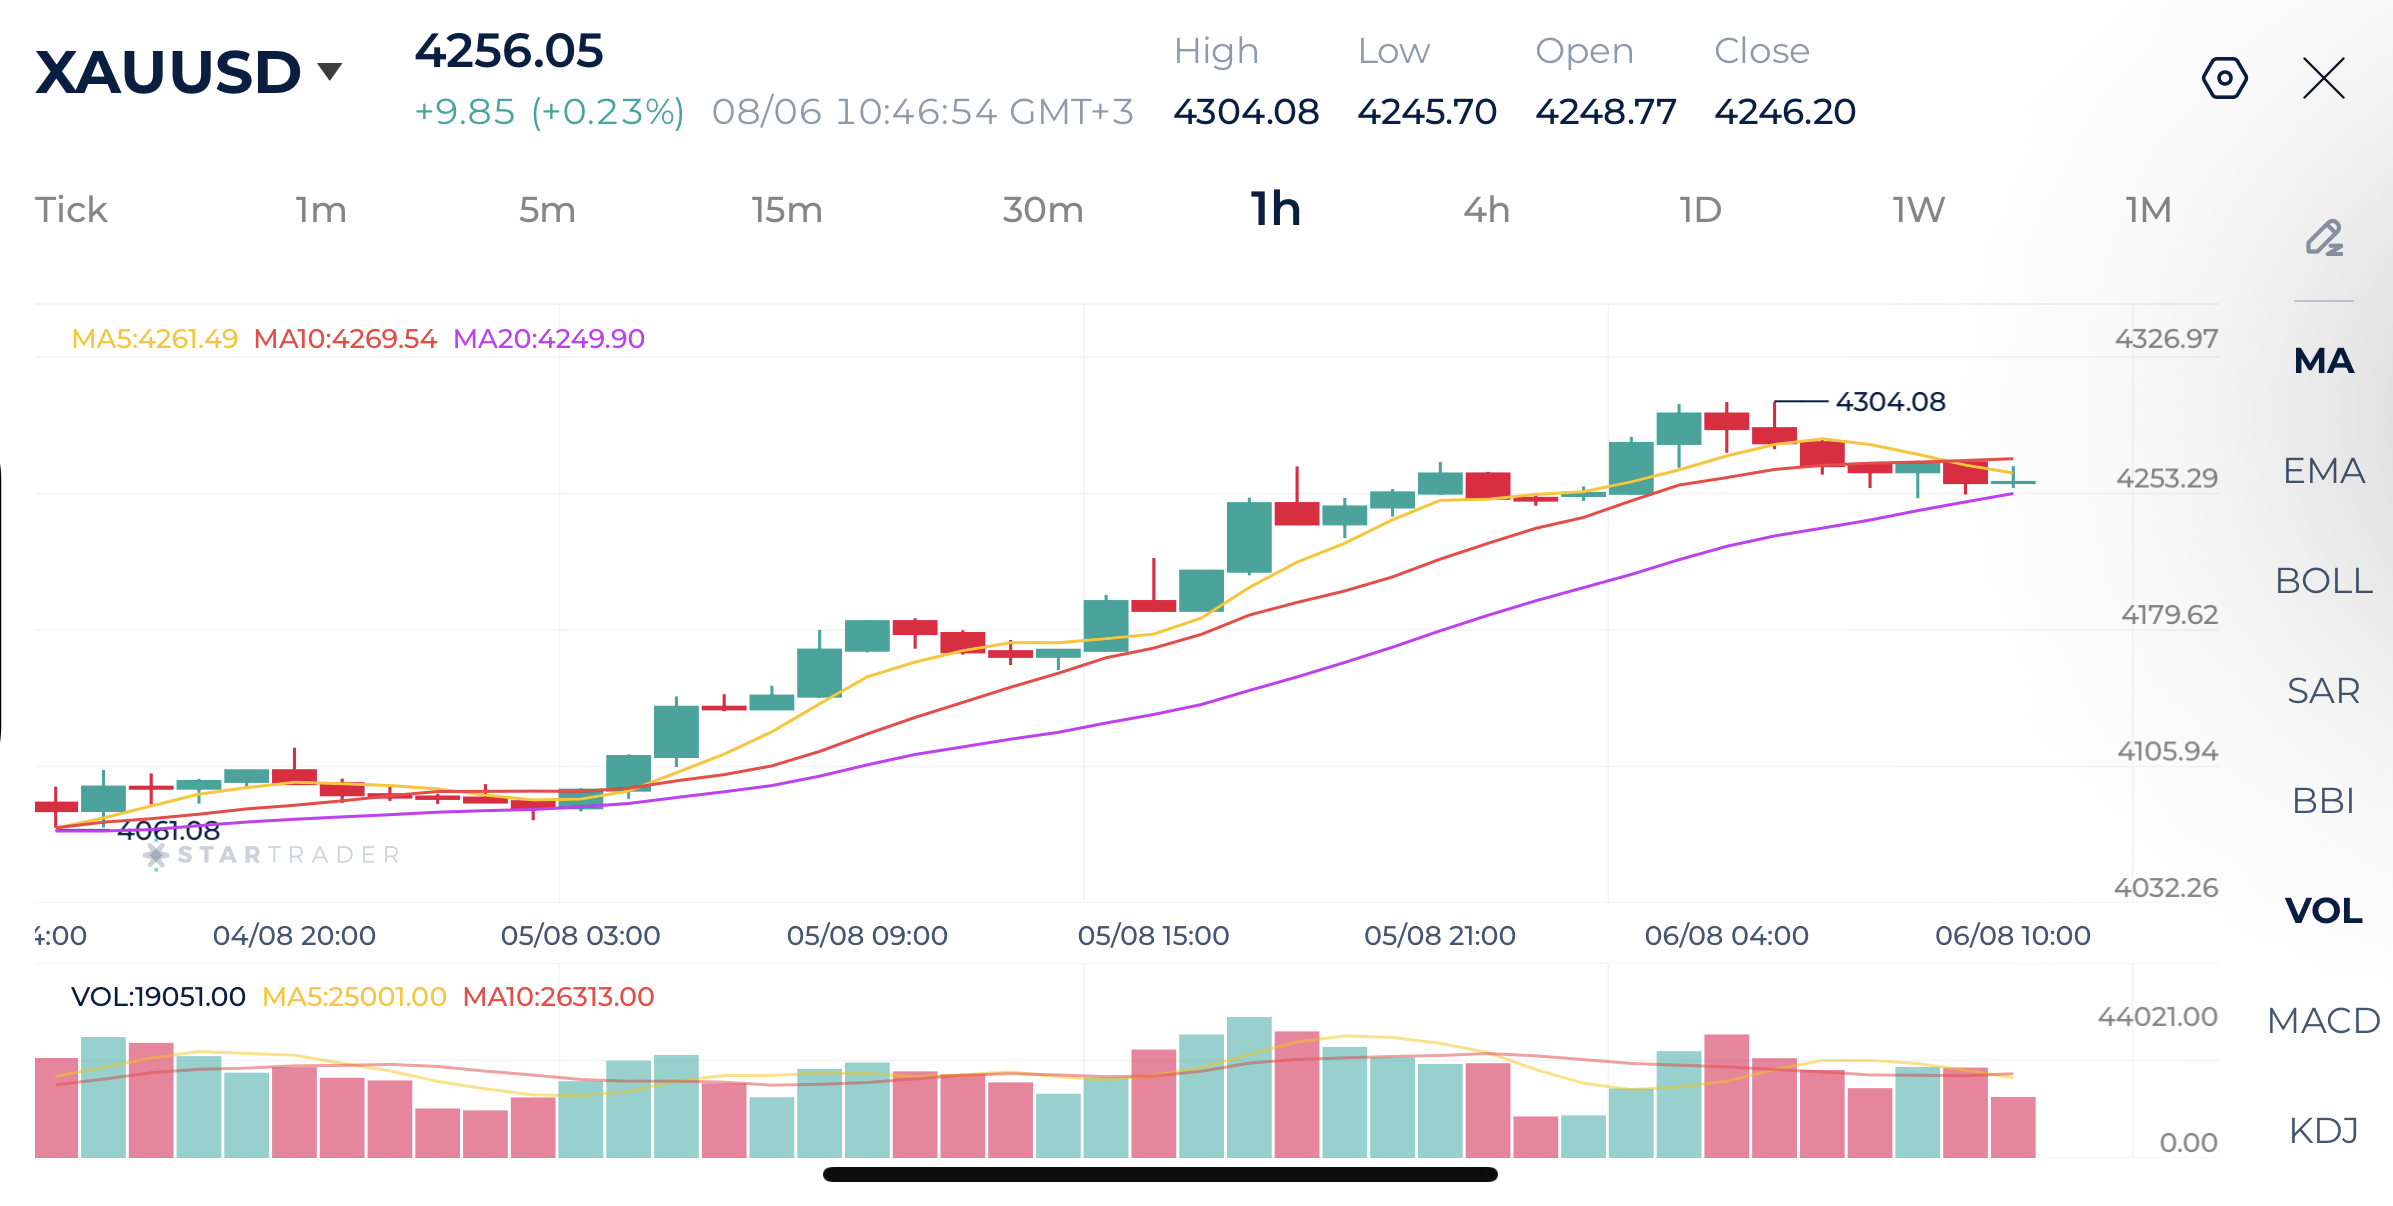
Source: STARTRADER app | Gold jumps above $4,300 an ounce following weak ADP NFP numbers
| Resistance | $4,304 | $4,355 | $4,400 |
| Support | $4,242 | $4,242 | $4,182 |
Dow Jones Technical Analysis
The Dow Jones is trading sideways after a strong rally, with price consolidating just below the recent high around 54,796. The three moving averages have converged, reflecting weakening short-term momentum and a temporary balance between buyers and sellers. Despite the consolidation, the index continues to hold above the rising 20-period moving average, preserving the broader bullish structure.
The narrow trading range suggests the market is waiting for a fresh catalyst before choosing its next direction. A decisive break above recent highs would likely revive bullish momentum and open the door for further gains, while a move below the 20-period moving average could encourage profit-taking and a deeper pullback toward the next support zone.
Dow Jones 1H Chart
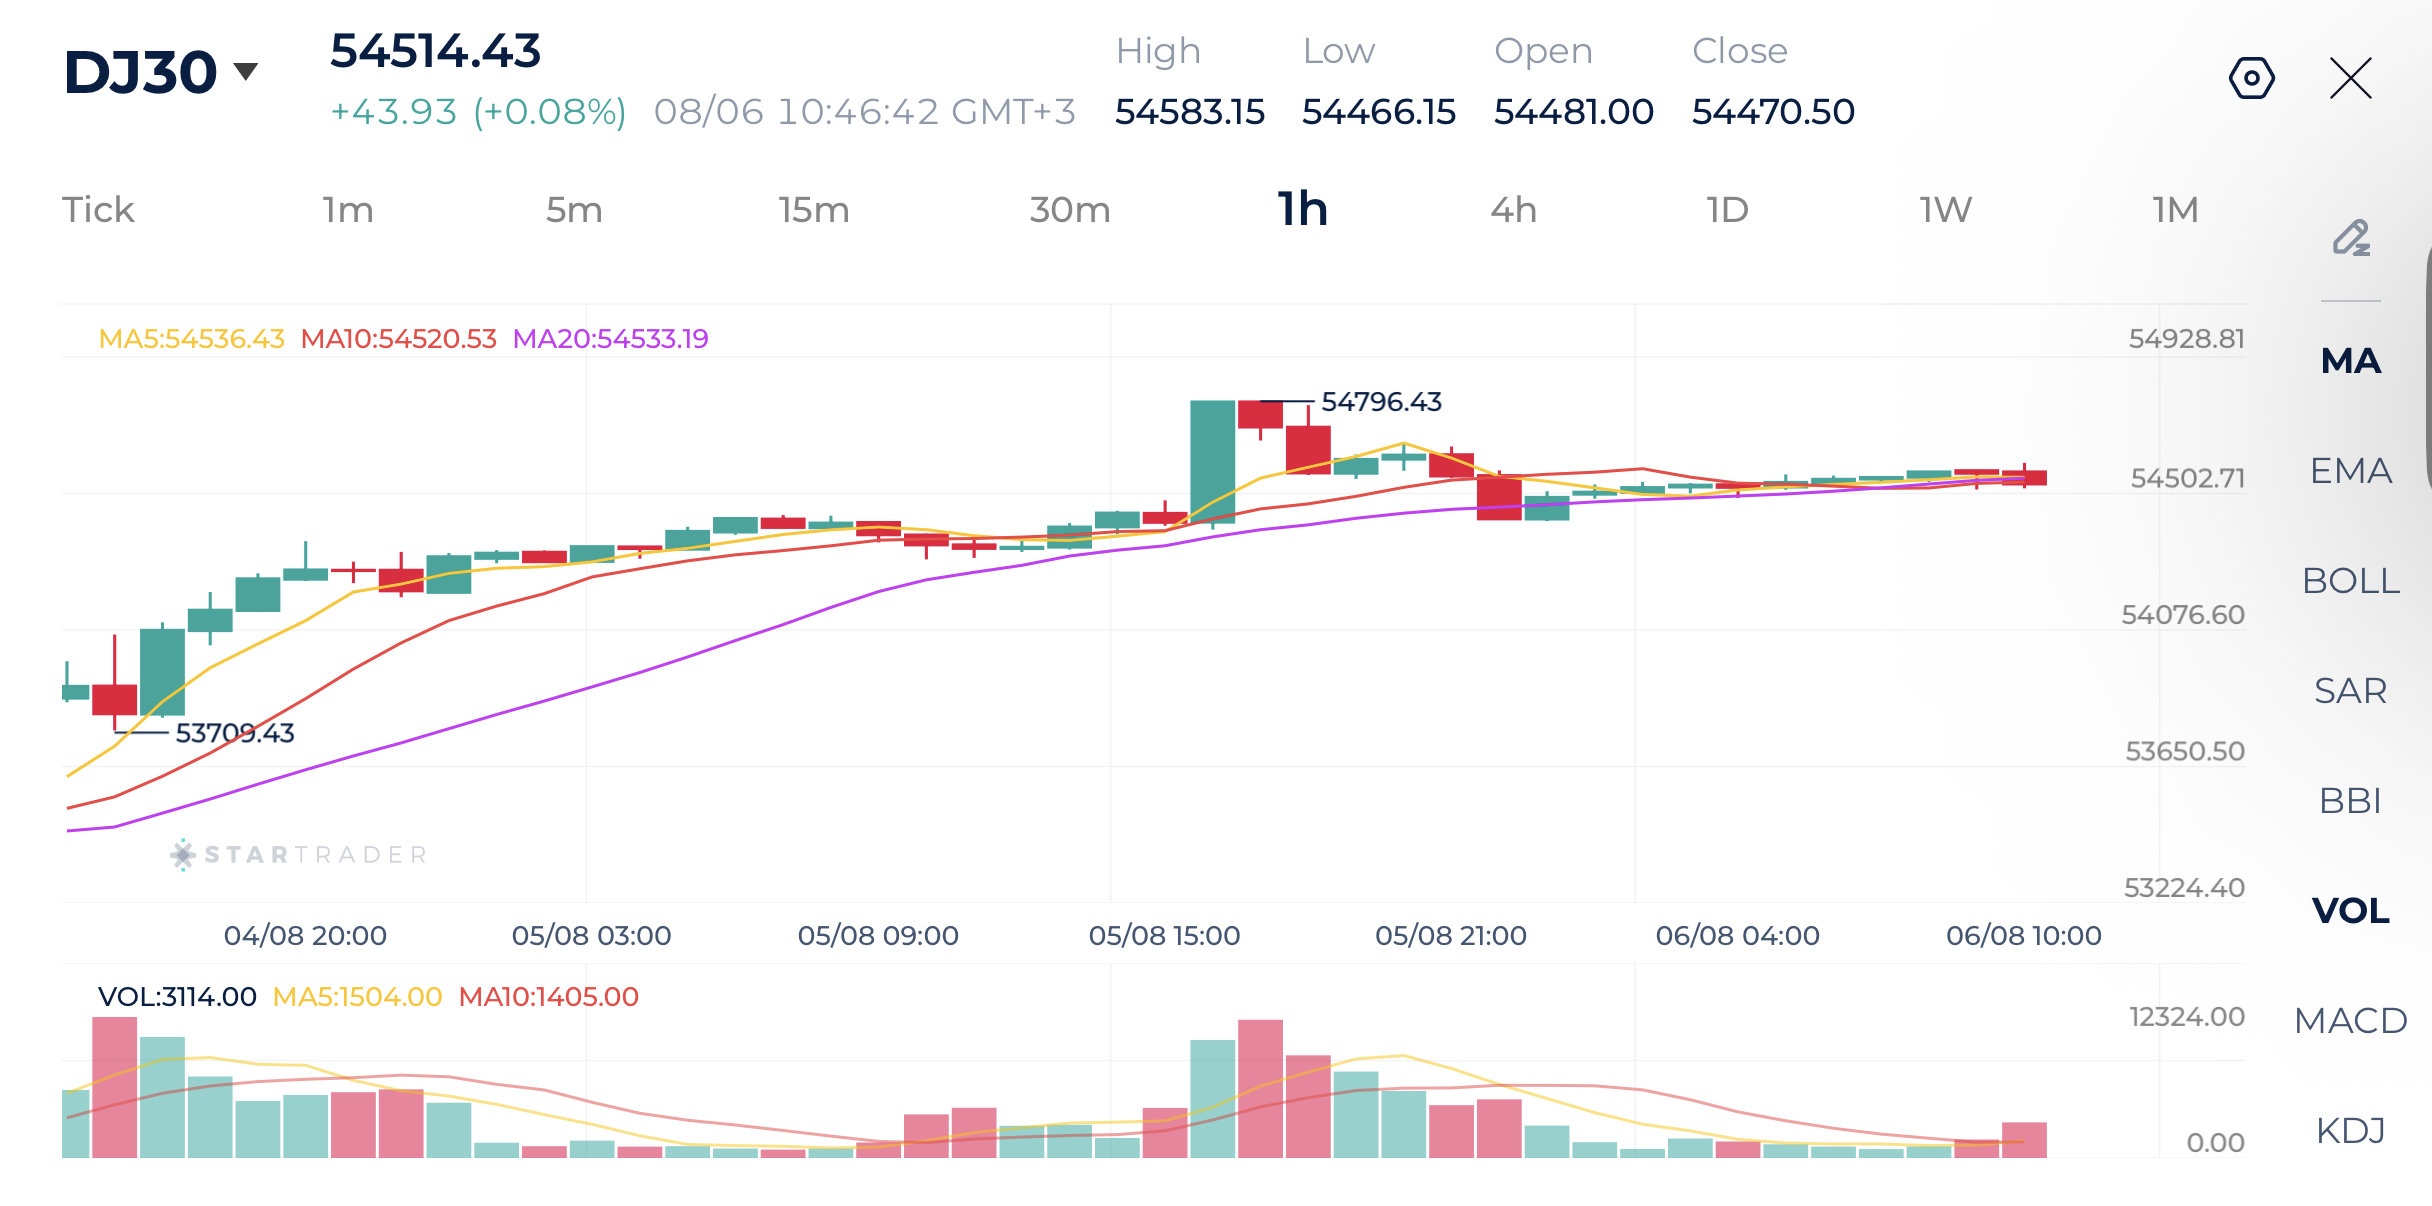
Source: STARTRADER app | Dow Jones breaks a new record high, supported by strong earnings
| Resistance | 54,526 | 54,593 | 54,735 |
| Support | 54,406 | 54,359 | 54,228 |
Risk Disclaimer: This material is provided for informational purposes only and does not constitute a recommendation or investment advice. Trading financial instruments on margin involves substantial risk and may not be appropriate for all investors.


Today Fundamental Analysis: Oil Breaks Above $102 as Middle East Tensions Continue to Escalate

Today Technical Analysis: Copper Approaches Record Highs on Surging Demand

Dollar struggles to gain ahead of US inflation data, yen extends rally

EBC Markets Briefing | Crude prices on solid footing amid deep supply concerns

The yen is strengthening before our very eyes

The Inflation Measure Keeping the Fed Cautious

US Yields Rise Despite Buybacks; Eyes on ECB Hike