
 (1)-25620261315.jpg)





Today Technical Analysis: Gold Rallies Past $4,400, Up Over 1% on the Day


Gold Technical Analysis
Gold is showing a strong recovery after a significant selloff, with the price rebounding from the recent low of $4,282 to around $4,436. Price is now trading above the moving averages MA(5), MA(10), and MA(20), which have begun to turn upward.
The immediate resistance is located around $4,443–$4,464, with the previous swing high at $4,464 representing the most important barrier. A sustained break above this area would strengthen the recovery and potentially target $4,480, followed by the $4,500 psychological level. On the downside, $4,398–$4,400 is now an important short-term support area around the 20-period MA, while a deeper correction could bring $4,329–$4,330 back into focus. Overall, the short-term bias has shifted from bearish to cautiously bullish, but gold needs to break above $4,464 to confirm that the current rebound is developing into a broader bullish reversal rather than simply a recovery within the previous downtrend.
Gold 1H Chart
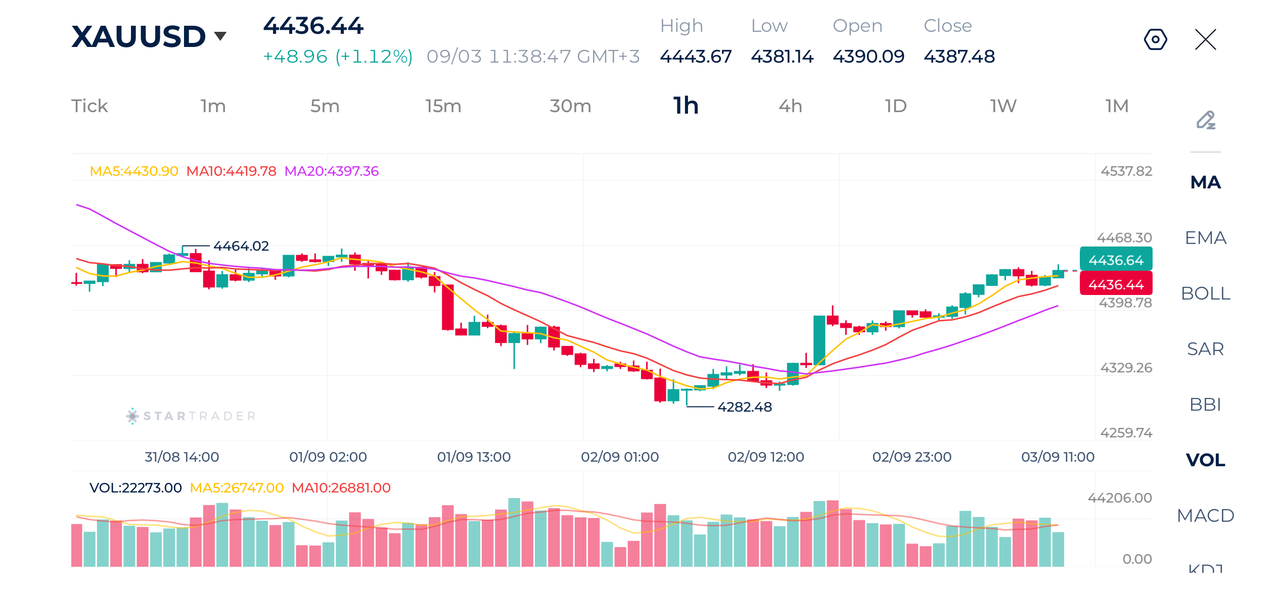
Source: STARTRADER app | Gold jumps 1% following weak ADP NFP numbers
| Resistance | $4,465 | $4,480 | $4,500 |
| Support | $4,400 | $4,339 | $4,282 |
Brent Technical Analysis
Brent crude remains in a strong bullish trend on the 1-hour chart, although the market is currently consolidating after reaching a recent high of $98.29. The broader structure remains constructive. The moving averages MA(5), MA(10), and MA(20) continue to support the bullish structure.
The key resistance remains the $98.30 area, which represents the latest swing high. A decisive break above this level could reinforce the bullish momentum and potentially expose $99.00–$100.00 as the next psychological targets. On the downside, $96.30–$96.50 is the first important support zone, followed by $93.90–$94.00 and then the $92.40 region. For now, the technical bias remains bullish as long as price holds above the moving-average cluster, although the recent consolidation suggests that crude may need another catalyst or a breakout above $98.30 to resume its upward momentum.
Brent 1H Chart
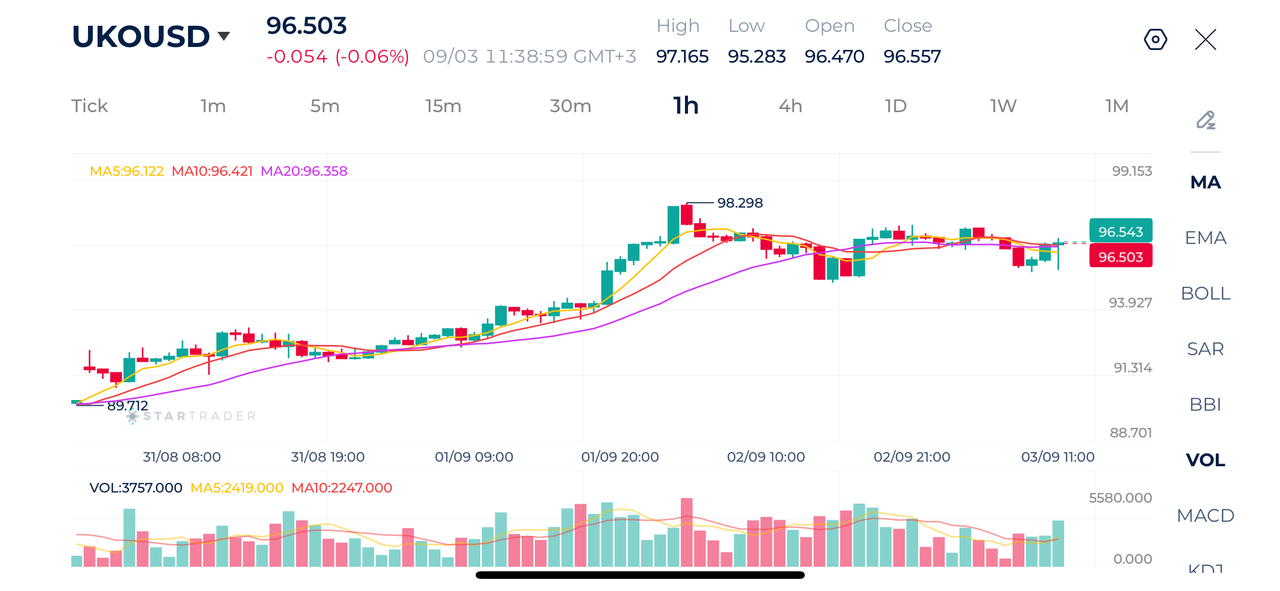
Source: STARTRADER app | Crude brent faces resistance above $98.00 but the overall bias remains bullish
| Resistance | $98.65 | $100.20 | $102.45 |
| Support | $96.30 | $92.40 | $91.20 |
USDJPY Technical Analysis
USDJPY is showing a strong bearish reversal on the 1-hour chart, with the pair falling sharply from the recent high of 160.38 to around 156.90. The moving averages MA(5), MA(10), and MA(20) have turned decisively bearish.
From a technical perspective, the 156.35–156.90 area is the immediate support zone, with the latest low at 156.34. A break below this area could open the way toward 155.50, followed by the psychologically important 155.00 level. On the upside, any recovery would initially face resistance around 157.20–157.80, where the short-term moving averages are clustered, followed by 158.35. Overall, the technical picture remains bearish, and rallies toward the moving averages could encounter selling pressure unless the pair manages to reclaim 158.35 and establish a higher high.
USDJPY 1H Chart
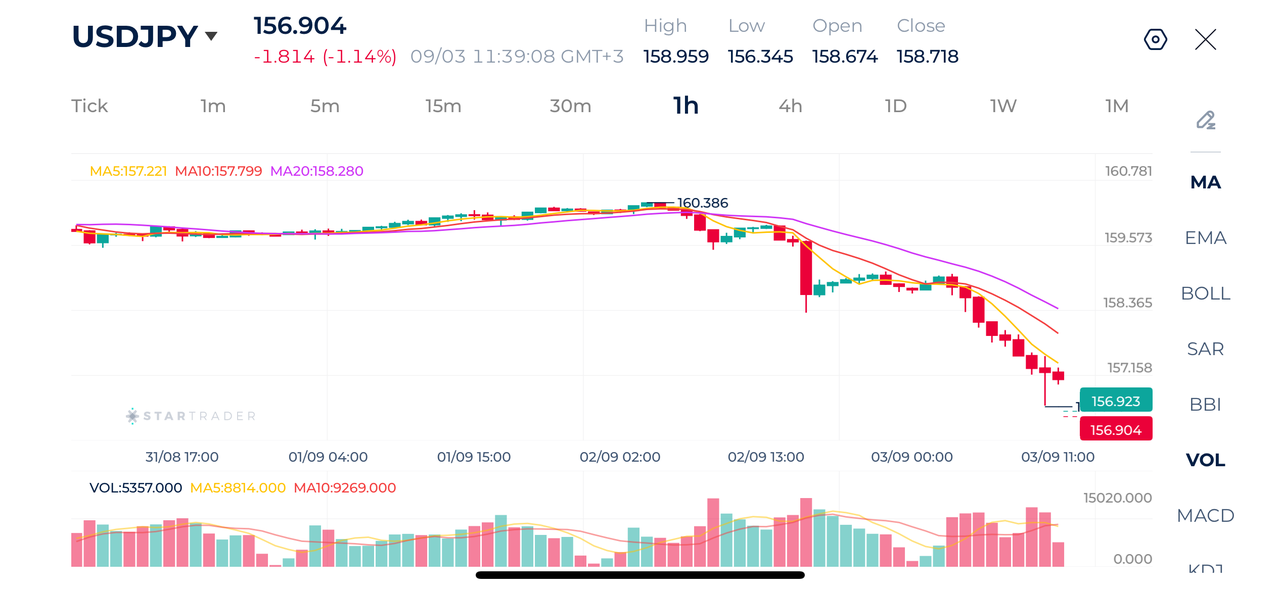
Source: STARTRADER app | USJPY falls sharply on hawish signals from the bank fo Japan
| Resistance | 157.80 | 158.35. | 160.00 |
| Support | 156.35 | 155.00 | 154.27 |
Risk Disclaimer: This material is provided for informational purposes only and does not constitute a recommendation or investment advice. Trading financial instruments on margin involves substantial risk and may not be appropriate for all investors.


The yen is strengthening before our very eyes

US Yields Rise Despite Buybacks; Eyes on ECB Hike

Today Fundamental Analysis: Brent Holds Around $100 Amid Fresh US-Iran Escalations

Today Technical Analysis: Japanese Yen Hits Highest Level Against the Dollar Since February

Yen Hits 6-Month High, Volatility Returns After North American Holiday.

USD/JPY Falls Below 154.000 as BOJ Rate Hike Bets Support Yen

USDJPY hits 7-month lows: recovery or bear trap?