 (1)-25620261315.jpg)





Daily Technical Analysis: Gold jumps 2% to trade above $4,140 as the dollar weakens

Dow Jones Technical Analysis
Dow Jones remains strongly bullish on the 1-hour chart after breaking above the previous consolidation zone and accelerating toward 53,644. Price is trading well above the moving averages MA(5), Ma(10), and MA(20) while all three averages are pointing higher, confirming strong upward momentum.
The index is currently consolidating just below its recent high, with 53,650 acting as immediate resistance. A sustained break above this level could open the way toward the psychological 54,000 area. On the downside, initial support is around 53,300–53,500, followed by 53,170. As long as price remains above these levels, the short-term technical bias remains bullish.
Dow Jones 1H Chart
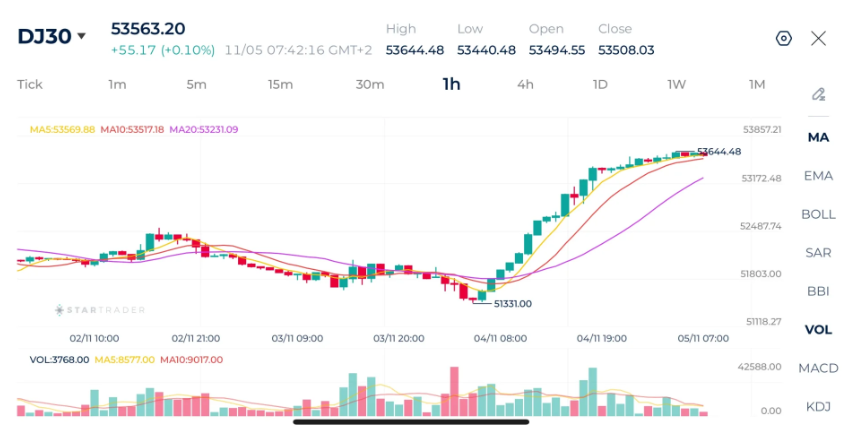
Source: STARTRADER app | Dow Jones surges more than 3% after the Democrats win in the mid-terms

Gold Technical Analysis
Gold has strengthened sharply on the 1-hour chart, reaching $4,146 this morning. The bullish momentum is particularly strong, with price trading significantly above the moving averages MA(5), MA(10), and MA(20), while all three averages are rising. Gold is now testing the $4,147 resistance area, and a decisive break above it could extend the rally toward $4,170 and potentially $4,200. However, after such a rapid advance, some short term profit taking cannot be ruled out. Initial support is around $4,090–4,100, followed by $4,050. The technical bias remains firmly bullish while price holds above these support levels.
Gold 1H Chart
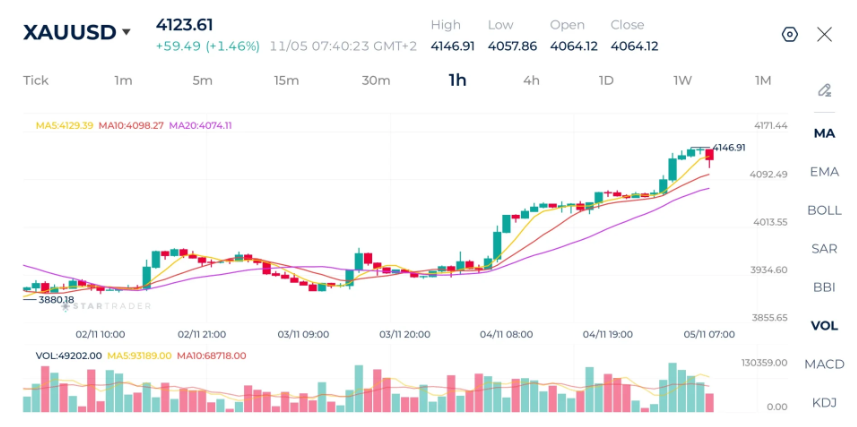
Source: STARTRADER app | Gold recovers strongly, rising more than 5% in the last two trading sessions

Brent Technical Analysis
Brent crude remains under significant selling pressure, trading around $97.80. The 1-hour chart shows a clear bearish structure, with price consistently forming lower highs and lower lows and remaining below the MA(5), MA(10), and MA(20) moving averages. The recent break below the $101–102 area further strengthened the bearish outlook, while price is now consolidating close to the recent low at $96.95. A break below this level could expose $95 as the next potential target, while any recovery is likely to face resistance around $100–101.40. The short term bias therefore remains bearish unless Brent can reclaim the $101 area.
Brent 1H Chart
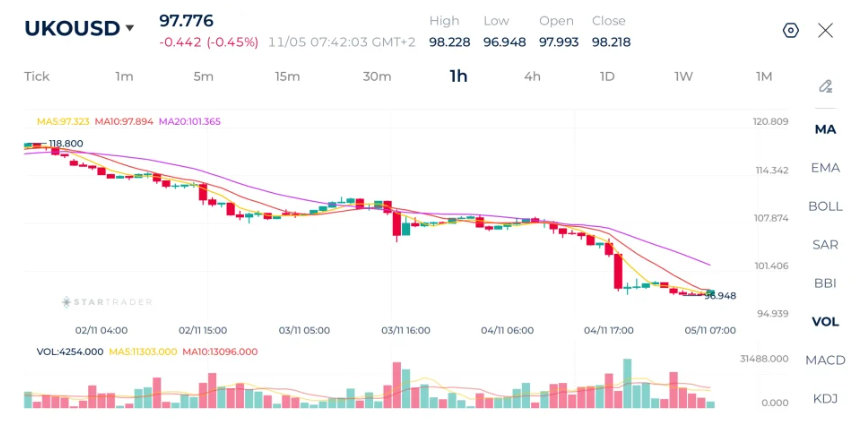
Source: STARTRADER app | Oil prices plummet with cooling geopolitical tensions

Risk Disclaimer: This material is provided for informational purposes only and does not constitute a recommendation or investment advice. Trading financial instruments on margin involves substantial risk and may not be appropriate for all investors.


Daily Fundamental Analysis: Dow Jones surges 1,500 points following Democrats win in election

🇺🇸 US Midterm Elections: Political Gridlock Raises Fiscal and Debt Risks

Dollar extends election-related slide, stocks rebound

The euro has spread its wings

Midweek Technical Look – US100, OIL, BTCUSD

Democratic Sweep Weakens the US Dollar and Lifts Precious Metals | 5th November, 2026

Dow Holds Near 53,578 After 3% Election Rally as Democrats Win Congress