 (1)-25620261315.jpg)





Daily Technical Analysis: Oil jumps 1% on fears of renewed strikes in the Middle East

Nasdaq Technical Analysis
The Nasdaq 100 is trading at 29,382. After reaching a recent high of 29,957, the index reversed sharply and has been recording a series of lower highs and lower lows.
Price is currently trading below all three moving averages MA(5), MA(10), and MA(20), which are aligned in bearish order, with the shorter term averages below the longer term average.
Immediate support lies around 29,356–29,325, followed by the recent low at 29,234. A break below this level could expose the 29,170 area. On the upside, initial resistance lies around 29,450–29,470, followed by 29,568 and 29,680. A recovery above 29,568 would suggest that selling pressure is easing, while a sustained move above 29,680 would provide stronger evidence of a trend reversal. Overall, the short-term bias remains bearish, with downside risks prevailing as long as the index trades below the 29,450–29,570 resistance zone.
Nasdaq 1H Chart
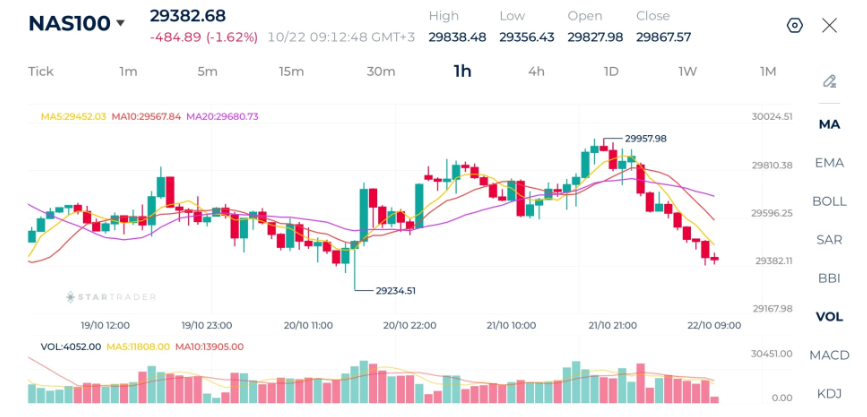
Source: STARTRADER app | Nasdaq reverses downward today after closing higher in yesterday’s session

Brent Technical Analysis
Brent crude is trading at $112.51. Following a sharp reversal from the recent low of $107.39, oil has established a recovery pattern characterized by higher lows and renewed buying momentum. After consolidating around $110–$111 during the previous session, prices have moved higher in the latest candles and are approaching the recent high of $113.41. This suggests that buyers are regaining control and that the market may be preparing to retest its recent peak.
The moving averages support the bullish structure. Price is trading above all three averages MA(5), MA(10), and MA(20). This bullish alignment indicates strengthening short-term momentum.
Immediate support lies around $112.00, followed by $111.60 and $111.00. A pullback toward these moving averages would not necessarily invalidate the bullish structure, provided buyers defend the support zone. On the upside, resistance is located around $112.65, followed by the recent high of $113.41. A decisive break above $113.417 could open the way toward $114.0 and potentially higher levels. Conversely, a move below $111.0 would weaken the bullish outlook and could expose the $110.4 area. Overall, Brent maintains a bullish short-term bias, with a potential continuation toward $113.4 if the current momentum persists.
Brent 1H Chart
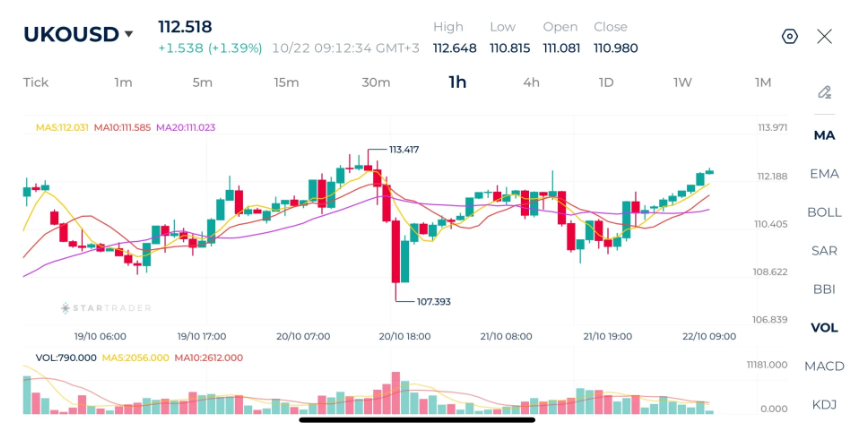
Source: STARTRADER app | Concerns about new strikes in the Middle East push oil prices higher

Gold Technical Analysis
Gold is trading below $4,100 as it continues to experience significant selling pressure. After consolidating around the $4,120–$4,140 region during the previous sessions, gold broke below this range and dropped sharply toward $4,090. The latest candles show only a limited rebound from the session low of $4,066, indicating that buyers have so far been unable to reverse the downward move.
The moving averages confirm the negative technical structure. Price is currently below all three averages MA(5), MA(10), and MA(20), which are aligned bearishly.
Immediate support lies at the recent low of $4,066, followed by the $4,055 area. A decisive break below $4,066 could extend the decline toward $4,055 and potentially lower levels. On the upside, initial resistance lies around $4,097–$4,111, followed by $4,121–$4,129. A recovery above $4,111 would indicate that selling pressure is easing, while a sustained move above $4,129 would provide stronger evidence of stabilization. Overall, gold remains firmly bearish in the short term, and any rebound is likely to face selling pressure while prices remain below the $4,111–$4,129 resistance zone.
Gold 1H Chart
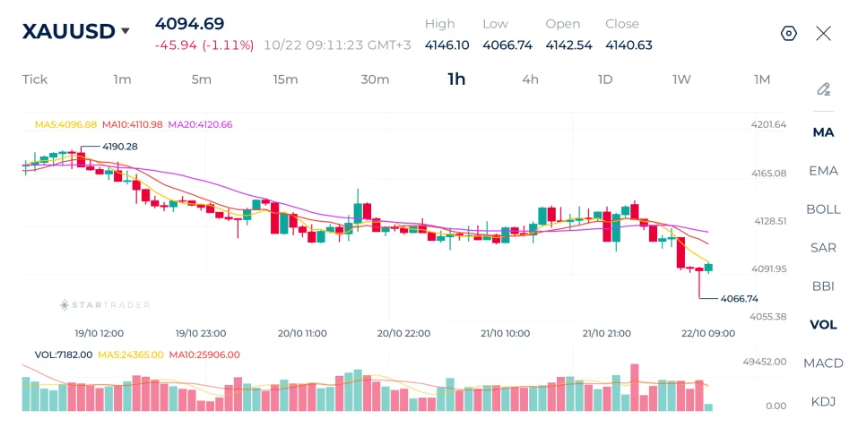
Source: STARTRADER app | Good attempts to rebound after falling below $4,100 psychological support

Risk Disclaimer: This material is provided for informational purposes only and does not constitute a recommendation or investment advice. Trading financial instruments on margin involves substantial risk and may not be appropriate for all investors.


Gold buying by central banks has hit its highest rate since 2024.

Daily Technical Analysis: Gold Reclaims $3,900 After Hitting Its Lowest Level Since October 2025

Daily Fundamental Analysis: Wall Street Starts November on a Cautious Note Ahead of US Midterm Elections

Bitcoin tests key support as election uncertainty and tech sell-off weigh

Will gold climb back above $4,000?

Crypto turns gloomy

US midterm elections in the spotlight as stock market rout persists