





Gold/Silver & Gold/Platinum Ratios: Deconstructing the Metals Sell-Off Divergence

Gold, silver and platinum all experienced significant declines in October 2026. However, their losses were far from equal. From the opening of October to the end-of-month close in October 2026, gold declined approximately 7.2%, while silver and platinum fell by approximately 19.1% and 16.6%, respectively, based on IUX market data.
This divergence raises an important question: why did gold demonstrate greater relative resilience during a broad precious metals sell-off? The difference may reflect more than short-term market sentiment. Each metal has a distinct demand structure, making its price sensitive to different economic and investment conditions.
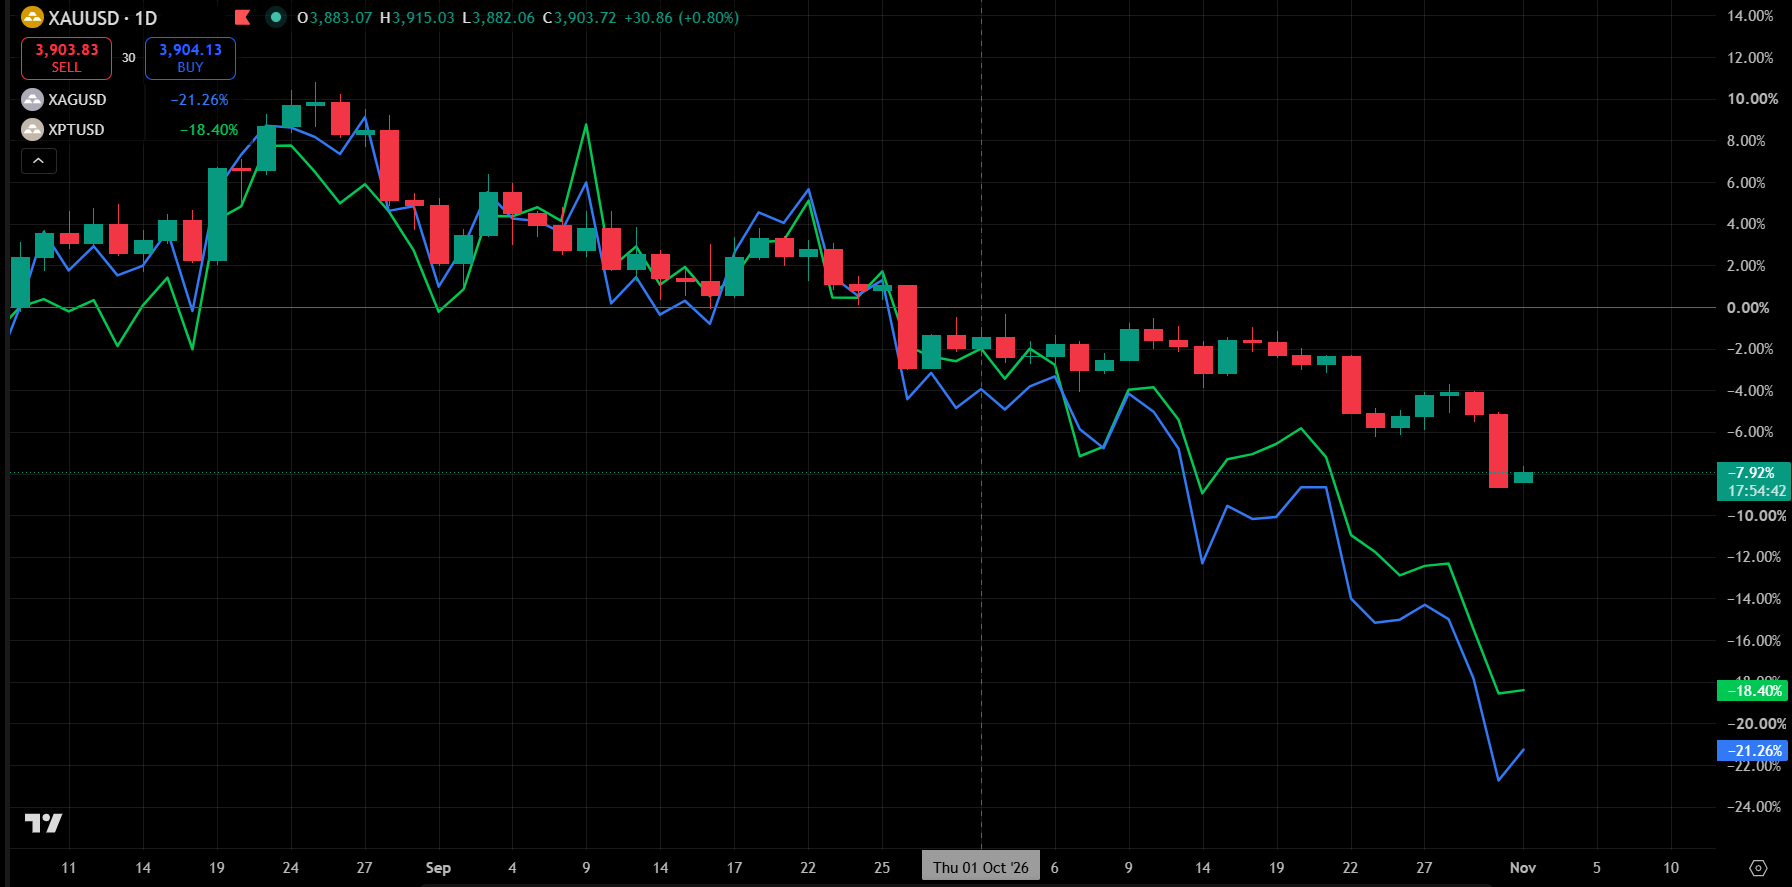
Figure 1: Percentage performance of Gold, Silver and Platinum
Why Gold Experienced a Smaller Decline
Gold's relative resilience may partly reflect its role in investment portfolios and official reserves:
- Monetary and reserve function: Unlike silver and platinum, gold has a prominent monetary role, with demand influenced by central-bank purchases, portfolio diversification and safe-haven considerations. This may provide gold with an additional source of investment demand during periods of market uncertainty.
- Higher interest-rate expectations: Rising energy prices and persistent inflation concerns during October strengthened expectations that US interest rates could remain higher for longer. This increased the opportunity cost of holding non-yielding assets, including gold.
- Federal Reserve policy and economic data: Federal Reserve policy and economic data: The Federal Reserve maintained its policy rate on October 28, 2026. Meanwhile, stronger-than-expected US CPI and GDP data contributed to changing market expectations regarding the future path of US interest rates. Persistent inflation concerns also added pressure to gold, which reached a one-year low on October 30.
- Liquidity pressures: Broader market liquidity pressures may also have contributed to the precious-metals decline, as losses in other asset classes can lead some investors to reduce positions or liquidate holdings to meet margin requirements. This suggests that even gold's traditional safe-haven role did not prevent it from being affected by wider market liquidity pressures.
Key note: Gold's smaller decline indicates relative resilience, not an absence of selling pressure or confirmation that safe-haven demand has strengthened.
Why Silver and Platinum Fell Further
Although both metals have significant industrial applications, their demand structures differ from gold and from each other. Their greater exposure to industrial activity and investment positioning may make their prices more sensitive to changes in economic expectations and market conditions.
Silver: Exposure to Industrial and Investment Demand
Silver serves both investment and industrial purposes, with applications across several sectors:
- Industrial applications: Silver is widely used in electronics, electrical components and photovoltaic (solar) technology.
- Declining photovoltaic demand: According to the Silver Institute's 2026 outlook, industrial silver fabrication is forecast to decline by approximately 3% this year, partly reflecting reduced silver consumption in the photovoltaic sector as manufacturers pursue material efficiency and substitution.
- Diverging industrial trends: This does not indicate a uniform collapse in industrial demand. Other applications, including electronics and automotive-related uses, are experiencing different demand trends.
- Multiple price drivers: Silver's greater price sensitivity relative to gold may reflect a combination of investment positioning, industrial expectations and market liquidity rather than one isolated factor. Its dual role as both an investment and industrial metal may expose it to selling pressure from more than one source during periods of market uncertainty.
Platinum: A Different Set of Industrial Drivers
Platinum has a distinct demand structure, with significant exposure to automotive and other industrial sectors:
- Automotive demand: Platinum is widely used in catalytic converters for vehicle emission-control systems.
- Other industrial applications: These include chemical production, glass manufacturing and hydrogen-related technologies.
- Market balance forecast: The World Platinum Investment Council (WPIC), in its September 2026 forecast, projected a market surplus of 265,000 ounces for the year. The projected 2026 surplus partly reflects investment outflows recorded during the first half of the year.
- Diverging sector demand: The forecast includes a 4% decline in automotive demand alongside a projected 5% increase in industrial demand. This highlights the contrasting trends across platinum's end-use sectors, with growth in industrial demand not fully offsetting weaker automotive demand and investment activity.
Taken together, these factors suggest that platinum's relative weakness may reflect a combination of investment outflows, softer automotive demand and the projected market surplus, rather than a broad decline across all industrial applications.
What the Gold/Silver and Gold/Platinum Ratios Reveal
The differences in demand structures provide context for the divergence, while relative price ratios offer another way to observe how the three metals performed against one another during the October sell-off. The Gold/Silver Futures Ratio and Gold/Platinum Futures Ratio compare the price of one ounce of gold with the price of one ounce of silver or platinum, respectively.
- When the ratios rise: Gold is outperforming the corresponding metal.
- When the ratios fall: Silver or platinum is outperforming gold.
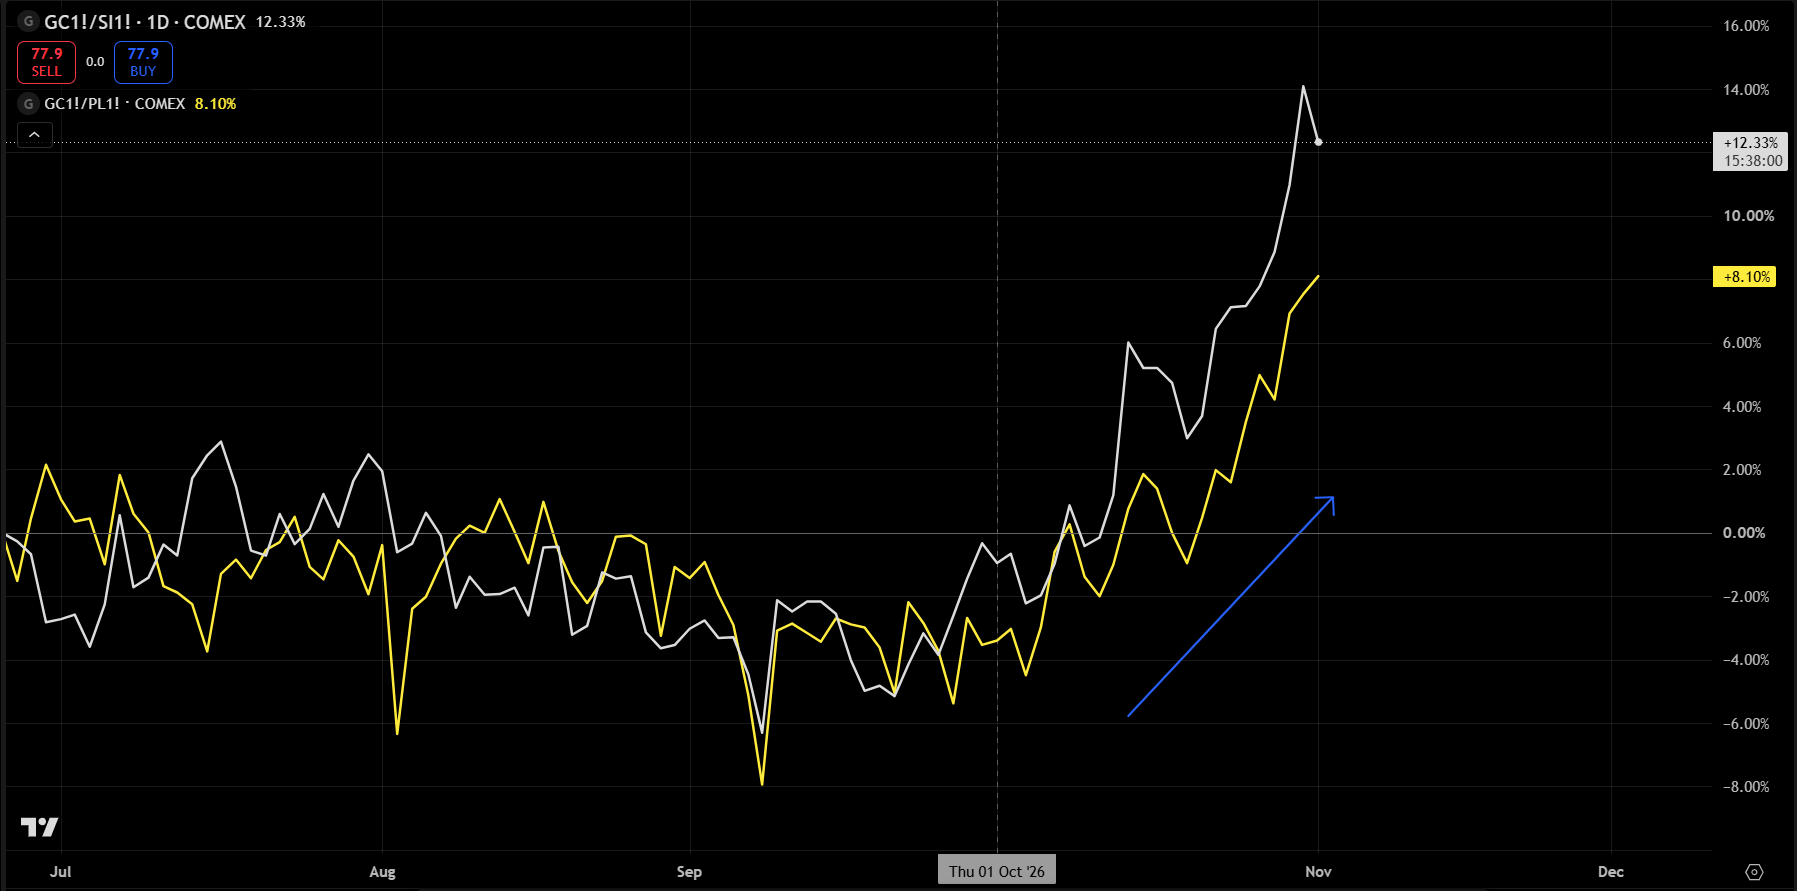
Figure 2: Gold/Silver Futures Ratio and Gold/Platinum Futures Ratio
Both ratios increased towards the end of October, indicating that gold retained greater relative strength against silver and platinum.
- Gold/Silver Futures Ratio: Its larger increase suggests that silver experienced greater relative weakness against gold over the period.
- Gold/Platinum Futures Ratio: Its increase also indicates that gold outperformed platinum.
However, these ratios measure relative price performance, not actual capital movements:
- An increase does not prove that investors are transferring funds from silver or platinum into gold.
- ETF flows, futures positioning and physical-market data are needed to assess investment activity more directly.
The rise in both ratios is consistent with the relative weakness observed in silver and platinum during October. However, it does not identify the precise cause of the divergence or provide a standalone signal about future price direction.
What Traders May Monitor in November
The relative performance of precious metals may continue to reflect changes in monetary expectations, investment demand and industrial conditions. Several indicators provide context for assessing these developments:
- US dollar and real yields: Changes in monetary conditions can influence the opportunity cost of holding non-yielding metals.
- Investment demand: Changes in investor positioning may contribute to differences in the relative performance of gold, silver and platinum.
- Industrial indicators: Solar-sector demand, automotive production and manufacturing activity provide insight into the different consumption drivers of silver and platinum.
- Relative ratios: Changes in the Gold/Silver and Gold/Platinum Ratios can illustrate whether gold's relative strength is widening or narrowing.
These indicators do not establish a particular price outcome. Their significance depends on how they interact with market positioning, liquidity and broader economic conditions.
Conclusion
October's precious metals sell-off highlighted differences in their demand structures and market sensitivities. Gold's monetary role may have provided relative support, while silver's industrial exposure and platinum's investment outflows and automotive demand pressures may have contributed to their sharper declines.
Gold's relative strength does not necessarily signal an upward trend. Understanding the different drivers behind these price movements provides a clearer perspective on the precious metals market.
Note: CFDs are complex instruments and come with a high risk of losing money rapidly due to leverage. 76% of retail investor accounts lose money when trading CFDs with this provider. You should consider whether you understand how CFDs work and whether you can afford to take the high risk of losing your money. This marketing publication is for informational and educational purposes only. It is not an investment recommendation. We do not suggest any investment strategy in this material, nor do we provide investment advice. The material does not take into account your individual financial situation, needs, or investment objectives. It does not constitute a solicitation or invitation to buy, sell, or engage with any product or service of IUX. We have prepared this marketing publication carefully and objectively. We present the facts known to the authors at the time of its creation. We do not include any judgmental elements. Information and research based on historical data or results, as well as forecasts, are not a reliable indicator of the future. We are not responsible for your actions or omissions, especially if you decide to purchase or sell financial instruments based on the information in this marketing publication. We are also not liable for any damages that may result from the direct or indirect use of this information. Investing is risky. Invest responsibly.
Source:
- The Silver Institute's 2026 outlook;
- The World Platinum Investment Council (WPIC);
- Higher interest-rate expectations;
- Rising energy prices;
- CPI; GDP.


EBC Markets Briefing | Aussie dollar propped up by US mid-term election uncertainty

Gold Edges Higher as Dollar Weakens Ahead of US Midterm Results

GBPUSD Edges Towards 1.3463 as Traders Brace for the Bank of England Decision

Weak NZ Jobs Data Keeps NZDUSD Under Pressure

Gold buying by central banks has hit its highest rate since 2024.

Daily Technical Analysis: Gold Reclaims $3,900 After Hitting Its Lowest Level Since October 2025

Daily Fundamental Analysis: Wall Street Starts November on a Cautious Note Ahead of US Midterm Elections