 (1)-25620261315.jpg)





Today Technical Analysis: Bitcoin Surges Past $80,000, Its Highest Level in Three Months

Bitcoin Technical Analysis
Bitcoin maintains a strong bullish short-term structure, trading around $80,730. The moving averages MA(5), MA(10), and MA(20) are clearly bullish. Price remains above all three averages and they are positively aligned, confirming that buyers continue to dominate.
The immediate resistance is $81,265, the latest high. A clean break above this level would strengthen the bullish momentum and potentially bring $82,000 into focus, followed by the $83,000 area. On the downside, $80,500 is the first short-term support, followed by $80,000 and the MA20 around $79,520. A deeper correction could reach $78,400, which was the previous breakout area.
Bitcoin 1H Chart
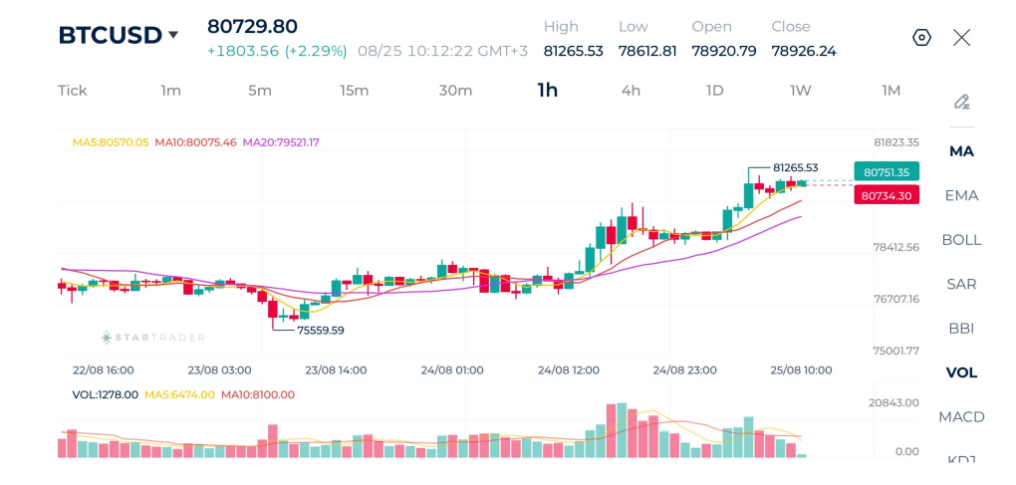
Source: STARTRADER app | Bitcoin surges past $80,000 as the bullish momentum continues

Gold Technical Analysis
Gold remains in a strong bullish trend, although the market is currently consolidating after reaching a high of $4,696. Price is trading around $4,641, having pulled back sharply from the high before stabilizing around the $4,620 area. Despite the recent correction, the broader structure continues to show higher highs and higher lows.
The moving averages MA(5), MA(10), and MA(20) remain supportive. Price is currently around the moving-average cluster, meaning short-term momentum has weakened, but the broader bullish structure has not yet been invalidated. The MA20 remains above the longer-term price structure and is still relatively elevated after the recent rally.
The key resistance is $4,696–$4,700. A decisive break above $4,700 could open the way toward $4,730 and potentially higher. On the downside, $4,620 is the first important support, followed by $4,600 and the stronger $4,510 area. Overall, the bias remains bullish, but gold needs to reclaim $4,650–$4,670 and eventually break $4,697 to resume strong upside momentum. A sustained move below $4,600 would weaken the bullish setup.
Gold 1H Chart
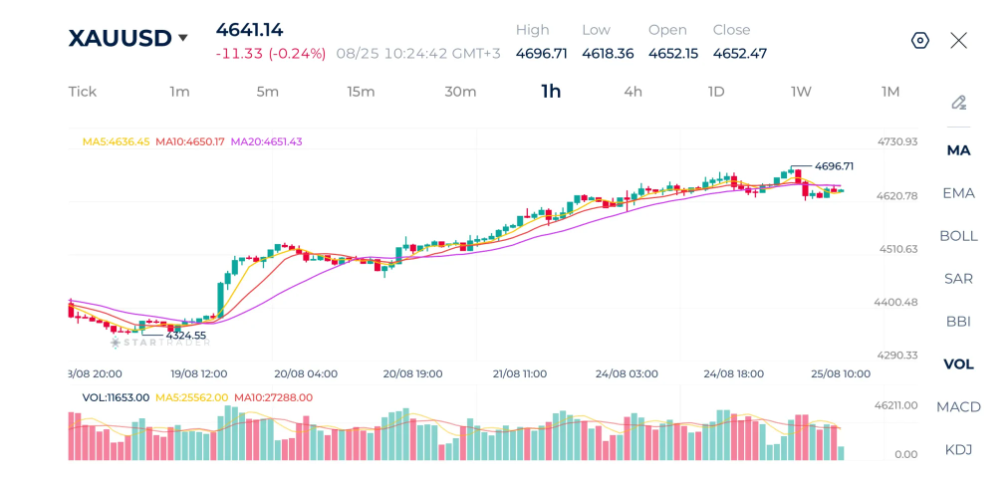
Source: STARTRADER app | Gold’s uptrend shows signs of cooling after nearing $4,700

Brent Technical Analysis
Brent crude is showing a short-term bearish trend, trading around $91.66 after falling from the recent high of $95.08. The chart shows a clear shift from the previous bullish structure into a sequence of lower highs and lower lows, particularly after the rejection near $95. The latest decline has pushed price below the key moving averages.
The moving averages MA(5), MA(10), and MA(20) are now bearish. Price is trading below all three, while the averages are pointing lower, confirming that sellers currently have the upper hand.
The immediate support is around $91.25–$91.55. A break below this zone could expose the previous major low around $90.86. On the upside, $92.10–$92.45 is the first resistance zone, corresponding to the moving-average cluster, followed by $92.85. The broader resistance remains around $94.17–$95.08. Overall, the bias is bearish below $92.45, with a sustained recovery above this area needed to signal a potential reversal.
Brent 1H Chart
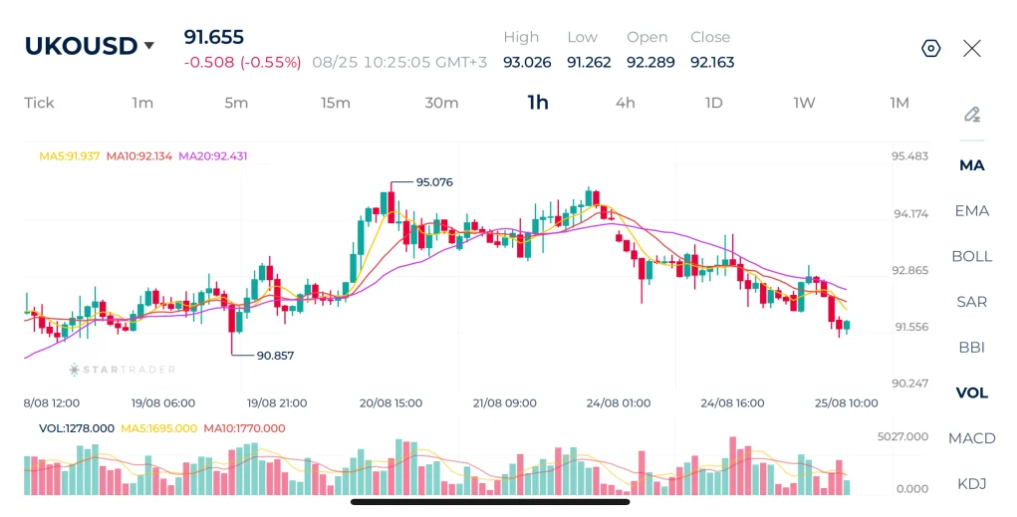
Source: STARTRADER app | Crude brent cools to $91 facing strong support area

Risk Disclaimer: This material is provided for informational purposes only and does not constitute a recommendation or investment advice. Trading financial instruments on margin involves substantial risk and may not be appropriate for all investors.


US Midterm Results Weigh on the Dollar as Central Bank Policy Divergence Builds | 4th November, 2026

EBC Markets Briefing | Euro remains structurally less secure than Swiss franc

The dollar concedes the Democrats’ victory

Democratic sweep weighs on dollar and yields, lifts gold

What the Democratic Midterm Win Means for Gold, US Stocks and Bitcoin

US Midterms: Early Democratic Senate Wins Sink Dollar and Drag Futures Lower

EBC Markets Briefing | Aussie dollar propped up by US mid-term election uncertainty