 (1)-25620261315.jpg)





Today Technical Analysis: Gold slides as the dollar index remains strong above 100 level

Gold Technical Analysis
Gold is undergoing a short-term corrective phase after reaching around $4,400. It is currently trading near $4,351, below the three moving averages MA5, MA10, and MA20. The three moving averages are beginning to turn lower, suggesting that short-term momentum has weakened.
The key support area is around $4,317, followed by $4,268 and the recent low near $4,235. On the upside, $4,400 is the first resistance level. A break above $4,400 would restore stronger bullish momentum, while a break below $4,317 could deepen the correction.
Gold 1H Chart
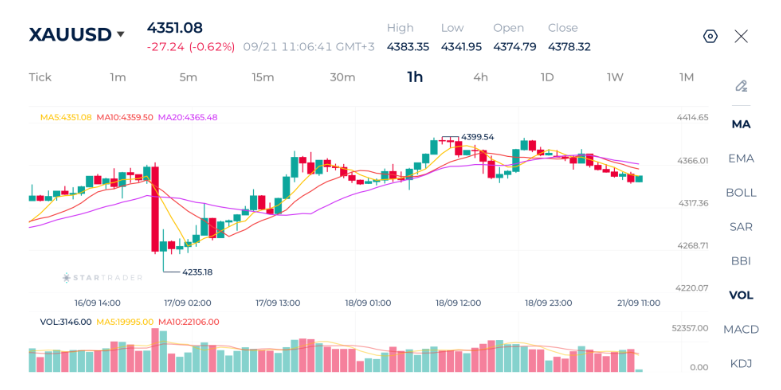
Source: STARTRADER app | Gold remains under pressure as the US dollar shows renewed strength

Brent Technical Analysis
Brent crude remains in a clear bearish trend, trading around $102.06 after falling to $101.51. Price is below the three moving averages MA5, MA10, and MA20, with the averages pointing lower. The sequence of lower highs and lower lows also confirms the bearish structure.
The immediate support is $101.50, followed by the psychological $100 level. A break below $101.50 could accelerate the decline toward $100. On the upside, $102.30–$103.30 forms the first resistance zone, while $105.00–$105.50 is a more significant barrier. Unless price reclaims the MA20, the technical bias remains bearish.
Brent 1H Chart
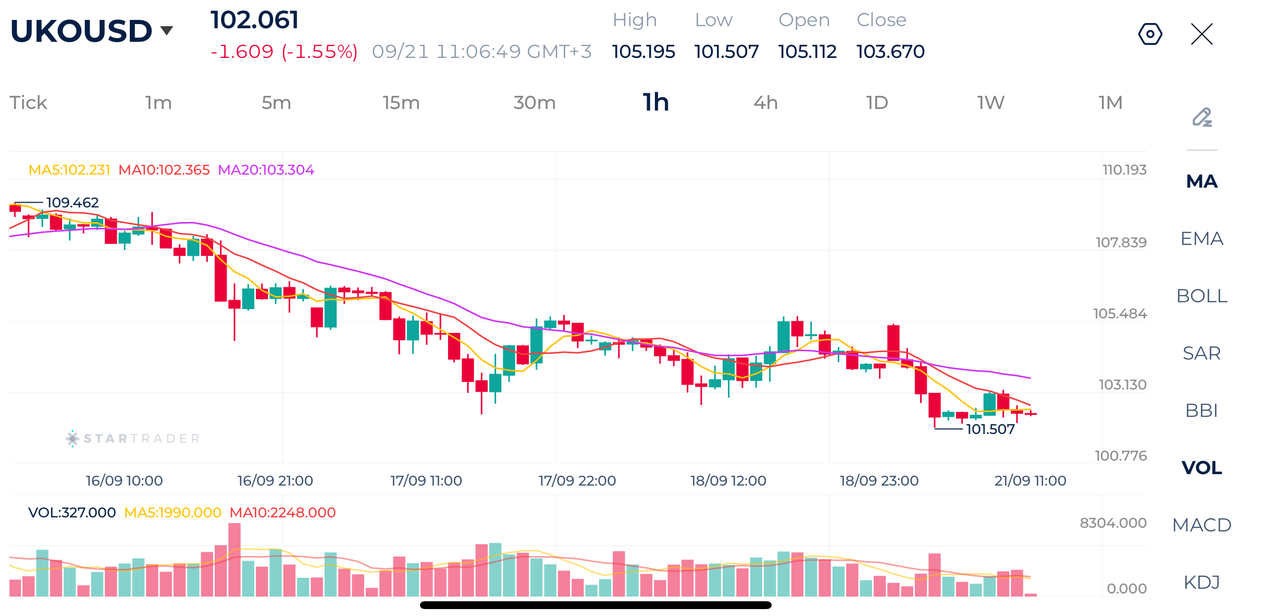
Source: STARTRADER ap | Crude brent trades lower on potential recovery in Saudi energy exports

S&P 500 Technical Analysis
The S&P 500 is showing strong bullish momentum, trading around 7,704 and pushing to a fresh intraday high of 7,706. Price is currently above the three moving averages MA5, MA10, and MA20, with all three averages aligned bullishly. The recent sequence of higher highs and higher lows reinforces the upside structure.
Immediate resistance is around 7,706–7,724, with a break above 7,706 potentially opening the way toward 7,750 and the broader 7,825 area. Support is around 7,690, followed by 7,668 and 7,610. As long as price holds above the MA20, the short-term trend remains bullish, although the gradual decline in volume suggests momentum should be monitored for signs of exhaustion.
S&P 500 1H Chart
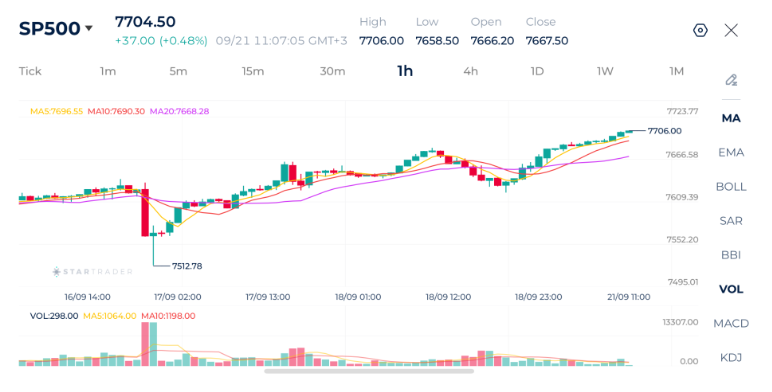
Source: STARTRADER app | S&P 500 rebounds strongly as it approaches the 7,700 level

Risk Disclaimer: This material is provided for informational purposes only and does not constitute a recommendation or investment advice. Trading financial instruments on margin involves substantial risk and may not be appropriate for all investors.


Gold buying by central banks has hit its highest rate since 2024.

Daily Technical Analysis: Gold Reclaims $3,900 After Hitting Its Lowest Level Since October 2025

Daily Fundamental Analysis: Wall Street Starts November on a Cautious Note Ahead of US Midterm Elections

Bitcoin tests key support as election uncertainty and tech sell-off weigh

Will gold climb back above $4,000?

Crypto turns gloomy

US midterm elections in the spotlight as stock market rout persists