





US500 Tests resistance as AI Optimism Meets the 5% Bond-Yield Problem

Summary
- US500 has reclaimed its 200-period WMA and is pressing against a major resistance cluster near 7,704.
- Momentum and volatility are improving together, but price remains inside the broader corrective channel from the August peak.
- Lower oil prices and renewed AI enthusiasm are supporting equities, while the Fed’s tightening bias and elevated Treasury yields remain the principal valuation constraint.
- A confirmed break above 7,704 would expose 7,766 and 7,828. Failure back below 7,627 would put the recovery under pressure.
Technical Thesis
US500 has moved from defensive stabilization into a genuine breakout attempt. The rebound from the September swing low near 7,503 has carried price back above the 200-period WMA at 7,666 and toward the upper boundary of the descending channel that has contained the market since August.
The technical question is therefore no longer whether buyers can produce a rebound. They already have. It is whether they can convert that rebound into a change of trend.
The decisive area is around 7,694-7,704, where the upper Bollinger Band, 38.2% Fibonacci level and descending channel resistance converge. Acceptance above this cluster would materially improve the medium-term structure.
4-Hour Chart: Recovery Reaches the Point That Matters
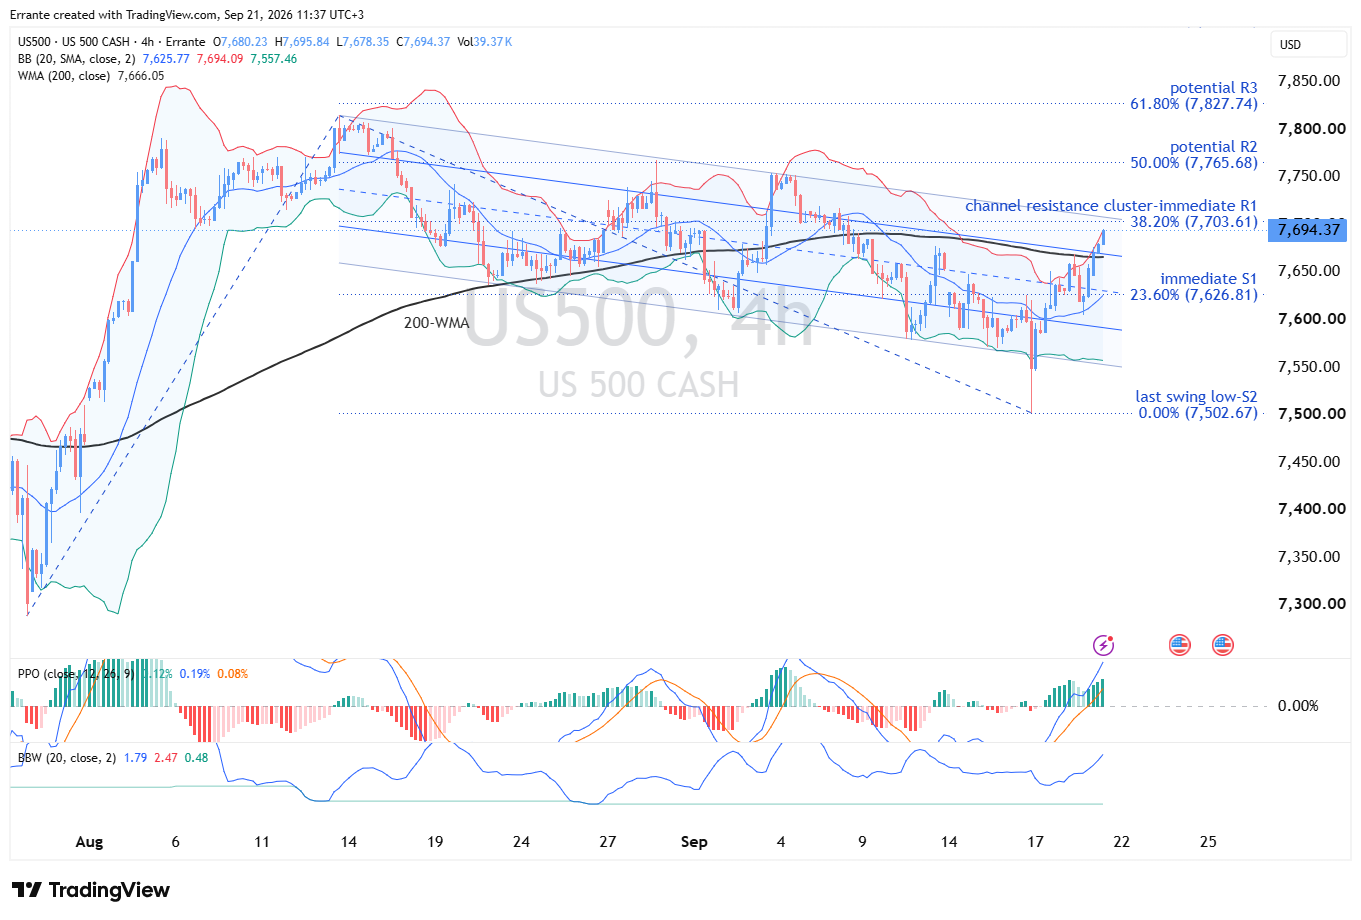
The September decline established a lower low near 7,503 before reversing sharply. Since then, price has built higher short-term lows and reclaimed both the Bollinger basis and the 200-WMA.
That is meaningful because the long-term moving average had previously acted as overhead resistance.
Price is now trading almost exactly against the upper Bollinger Band near 7,694. In isolation, that reflects strength rather than an automatic overbought condition. The complication is that the same area also contains the declining upper channel boundary.
A close through 7,704 would therefore do more than clear a Fibonacci level. It would challenge the sequence of lower highs that has defined the correction since August.
Above it, the chart opens toward 7,766 and then the August high region around 7,828. Below current price, 7,627 is the first meaningful support, while the reclaimed 200-WMA near 7,666 acts as an important tactical pivot.
Momentum and Market Conditions
Momentum is now confirming the recovery.
PPO has crossed decisively into positive territory and its histogram is expanding, indicating that upside rate-of-change is accelerating rather than merely stabilizing.
Bollinger Band Width is also rising from its recent contraction. That matters because volatility expansion is occurring in the same direction as price.
This is the combination technicians want to see during a breakout attempt: improving structure, positive momentum and expanding volatility.
The missing ingredient is acceptance beyond resistance. Until that arrives, the move remains a recovery within a larger declining channel rather than a completed bullish regime change.
Key Levels to Watch
Resistance
7,704 – 38.2% retracement, channel resistance and immediate breakout trigger7,766 – 50% retracement and first confirmed continuation target7,828 – 61.8% level and August-high region
Support
7,666 – 200-period WMA and reclaimed trend pivot7,627 – 23.6% retracement and immediate support7,503 – September swing low and structural downside reference
Scenario Outlook
Bullish Scenario: Oil Relief Gives AI Room to Run
A sustained close above 7,704 would confirm that the recent recovery has escaped the corrective channel.
The macro backdrop for such a move already exists in partial form. Cheaper oil reduces near-term inflation anxiety, while strong global semiconductor demand is reviving enthusiasm around AI-linked technology.
Because technology carries enormous weight in the S&P 500, a broad semiconductor rally can move the index even when other sectors are merely stable.
Technically, confirmation above 7,704 would target 7,766 first and 7,828 thereafter.
Neutral Scenario: Earnings Win, Valuations LoseThe index could remain trapped between roughly 7,627 and 7,704 if investors continue to receive conflicting messages.
Corporate earnings remain robust, but Treasury yields near historically restrictive levels raise the hurdle rate for equities. In discounted-cash-flow terms, stronger earnings increase the numerator while higher rates reduce the present value investors are willing to assign to those earnings.
That tension can sustain a market without producing a clean breakout.
Bearish Scenario: The 5% Yield Ceiling Becomes a Floor
The larger downside risk is a renewed Treasury selloff.
The Fed has already raised rates, and policymakers continue to warn that strong demand may be contributing to persistent inflation. If the 10-year yield moves decisively back above 5%, richly valued growth stocks would again face pressure through higher discount rates.
A move below 7,627 would be the first technical warning. Loss of the 200-WMA would then expose 7,503 and revive the broader corrective trend.
Trading Considerations
For breakout traders, 7,704 is the level that matters. An intraday move above it is less useful than a close supported by expanding range and persistent positive PPO momentum.
Pullback buyers have a cleaner reference at the 7,666-7,627 zone. Holding that area would preserve the higher-low recovery structure without requiring investors to chase price directly into resistance.
Bearish traders need evidence of failure. A rejection from 7,704 alone may simply produce consolidation. Loss of 7,627 would provide the more meaningful deterioration signal.
The current volatility expansion also argues for disciplined position sizing. Wider ranges require wider technical stops or smaller positions if portfolio risk is to remain constant.
Intermarket Perspective
The market is being pulled by two powerful forces.
Technology is the engine. Record Korean chip exports and renewed gains in Intel, AMD and other AI-linked names show that demand for computing infrastructure remains strong. This matters disproportionately because technology represents close to two-fifths of S&P 500 capitalization.
But the same AI boom creates its own financial constraint. Data centers require enormous capital expenditure, and part of that investment is being financed through debt markets. Heavy corporate issuance competes with Treasury supply for investor capital, contributing indirectly to higher yields.
Energy provides temporary relief. Brent's retreat toward $101 reduces pressure on transport, consumer discretionary and industrial margins while easing the immediate inflation impulse. Energy producers lose some pricing support, but the broader index benefits because lower fuel costs operate like a small tax cut for households and businesses.
Financials occupy the middle ground. Higher rates can support asset yields, but a disorderly rise in long-term borrowing costs eventually weakens credit demand and raises default risk. Banks prefer a healthy yield curve, not a bond-market accident.
The dollar adds another clue. DXY around 100.2 remains firm but has not surged despite aggressive U.S. rate repricing. That suggests the rise in yields partly reflects fiscal risk and term premium rather than an unambiguous improvement in U.S. monetary-policy credibility.
Finally, this week's U.S.-China meetings introduce an important industrial and technology variable. A reduction in trade friction would help semiconductors, industrial exporters and global cyclicals; deterioration would hit precisely the sectors currently driving the recovery.
Final Conclusion
US500 has reached the line separating a rebound from a trend change.
The recovery has reclaimed the 200-WMA, momentum is strengthening and volatility is expanding. But the declining channel has not yet been defeated.
Above 7,704, the balance shifts toward 7,766 and 7,828.
Below 7,627, the recovery starts to lose its technical credibility.
The macro equation is equally simple: AI earnings are supporting the numerator, while Treasury yields are attacking the valuation multiple. For now, cheaper oil is giving equities some breathing room.
Whether that becomes a sustainable breakout depends on which gets there first: stronger earnings confidence or another visit above 5% for the 10-year yield.


Gold buying by central banks has hit its highest rate since 2024.
Daily Technical Analysis: Gold Reclaims $3,900 After Hitting Its Lowest Level Since October 2025

Daily Fundamental Analysis: Wall Street Starts November on a Cautious Note Ahead of US Midterm Elections
Bitcoin tests key support as election uncertainty and tech sell-off weigh

Will gold climb back above $4,000?

Crypto turns gloomy

US midterm elections in the spotlight as stock market rout persists