
 (1)-25620261315.jpg)





Today Technical Analysis: Bitcoin falls below $63,000 for the first time since February

Gold Technical Analysis
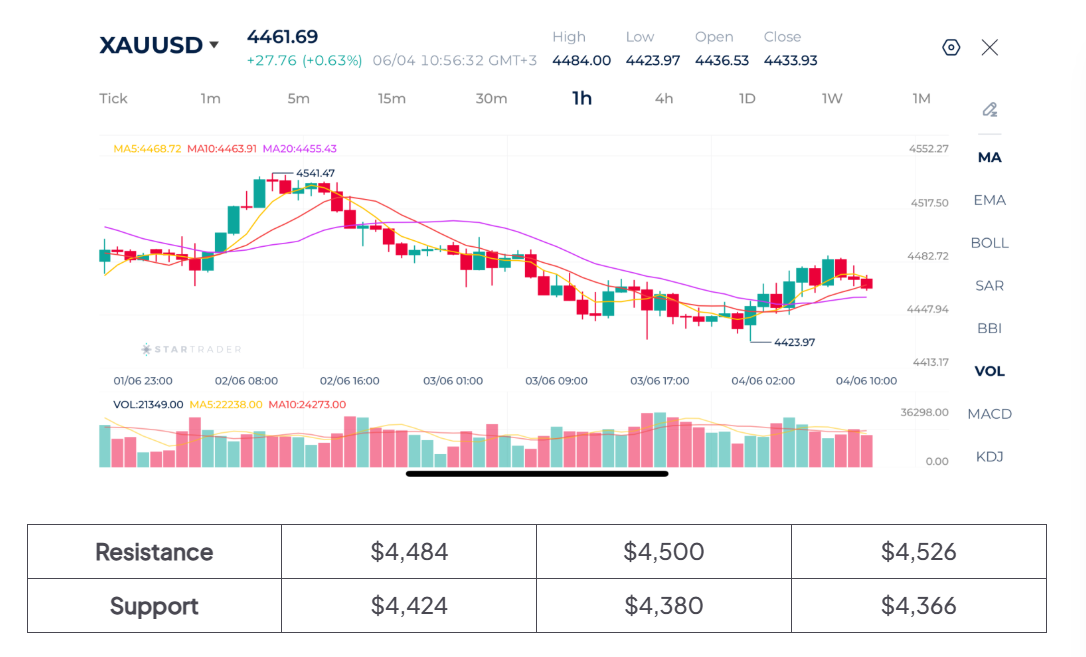
Gold has begun to stabilize following a sharp decline that pushed prices down to a low of $4,423. The precious metal has managed to recover from those lows and is currently trading above the 20-period moving average, indicating that buyers are attempting to regain short-term control. However, price is still trading below the major swing high at $4,541 and has yet to establish a bullish trend.
Immediate resistance is located around $4,480–$4,490, followed by $4,517 and then the major swing high at $4,541. On the downside, support is found at $4,455, followed by $4,423 and then $4,400. The short-term outlook has improved from bearish to neutral, but gold needs a strong break above $4,490 to confirm that a more meaningful recovery is underway.
Gold 1H Chart
Source: STARTRADER app | Gold rebounds slightly as the US dollar face some pressure
Brent Technical Analysis
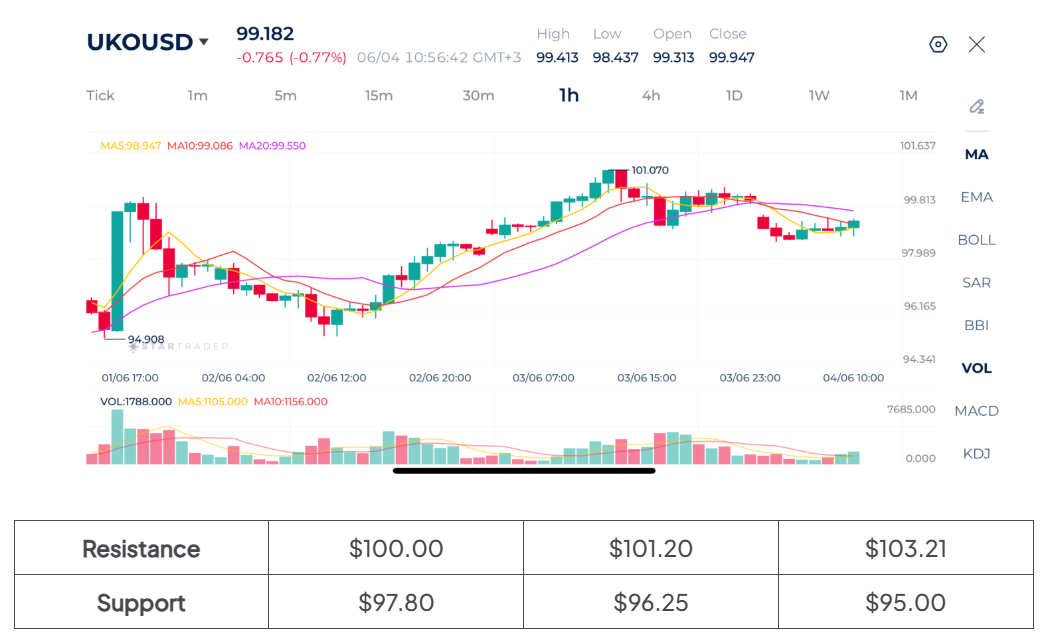
Brent crude oil continues to display a constructive bullish structure despite the latest pullback from the $101.07 high. The market remains supported by a series of higher highs and higher lows that have developed since the rebound from the $94.90 area. Although price is currently consolidating below recent highs, it continues to trade close to key moving averages, suggesting that the broader uptrend remains intact.
After reaching $101.07, oil entered a consolidation phase characterized by relatively shallow retracements and limited selling pressure. The 20-period moving average around $99.55 continues to provide underlying support, while the 5-period and 10-period moving averages are beginning to flatten as momentum cools.
A break above $100.00 and subsequently $101.07 would likely signal renewed bullish momentum and open the door toward higher levels. Conversely, a sustained move below $98.50 could trigger a deeper correction toward the 20-period moving average and potentially the $97.00 area. For now, the overall bias remains moderately bullish while price holds above the key support zone.
Brent 1H Chart
Source: STARTRADER app | Oil prices fluctuate as geopolitical uncertainties weigh on markets
Bitcoin Technical Analysis
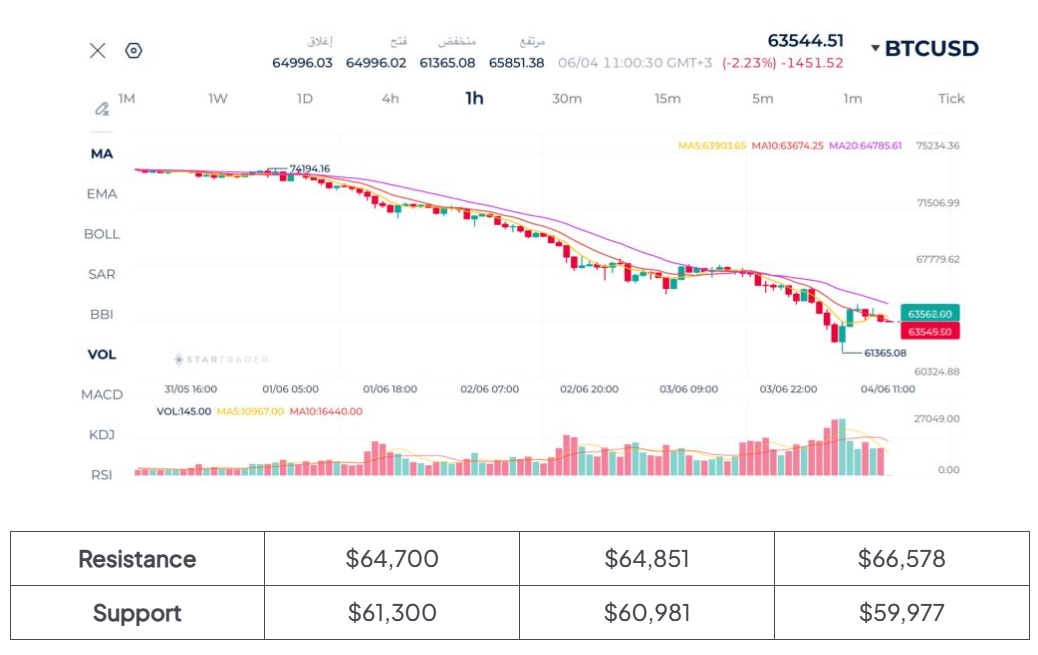
Bitcoin remains under significant bearish pressure on the hourly timeframe after experiencing a sharp decline to $61,365. The overall structure continues to favor sellers, as price remains below the 5-period, 10-period, and 20-period moving averages. The moving averages are also bearishly aligned, with the shorter-term averages trading beneath the longer-term average, confirming that downward momentum remains dominant despite occasional recovery attempts.
The latest candles show weakening bullish momentum and renewed selling interest around resistance levels. Immediate support is located at $63,365, followed by the recent low at $61,365. A break below this level could accelerate downside pressure toward the psychological $60,000 area. On the upside, resistance is found at $64,000, followed by the 20-period moving average near $64,800 and then the larger resistance zone around $67,000. Overall, the short-term outlook remains bearish unless Bitcoin can reclaim and hold above the 20-period moving average.
Bitcoin 1H Chart
 Source: STARTRADER app | Bitcoin plummets below $62,000 as liquidations hit $1.8B
AUTHOR
Ghassan Albohtori
Financial Market Analyst - STARTRADER
Ghassan Albohtori is a financial market analyst with experience in macroeconomics, investing, and currency trading. He conducts in-depth market research covering fundamental and technical analysis of different instruments to find major changes in market trends. Mr. Ghassan's main focus is the effects of economic data on different asset classes and how this affects prices.
Risk Disclaimer: This material is provided for informational purposes only and does not constitute a recommendation or investment advice. Trading financial instruments on margin involves substantial risk and may not be appropriate for all investors.


Today Fundamental Analysis: Oil Breaks Above $102 as Middle East Tensions Continue to Escalate

Today Technical Analysis: Copper Approaches Record Highs on Surging Demand

Dollar struggles to gain ahead of US inflation data, yen extends rally

EBC Markets Briefing | Crude prices on solid footing amid deep supply concerns

The yen is strengthening before our very eyes

The Inflation Measure Keeping the Fed Cautious

US Yields Rise Despite Buybacks; Eyes on ECB Hike