
 (1)-25620261315.jpg)





Today Technical Analysis: Gold falls below $4,500 support as the US dollar index approaches 99.50

Gold Technical Analysis
The hourly chart for gold reveals a strong and sustained bearish trend, with the precious metal currently trading down at around $4,460. The price action is consistently moving beneath moving averages MA5, MA10, and MA20 lines, which are in a bearish alignment and acting as dynamic resistance overhead.
The descent accelerated noticeably after breaching the $4,521 level, eventually finding a temporary support at $4,453. While the most recent candle shows a minor green correction, the overall lack of robust buying volume suggests that the bias remains to the downside, keeping a retest of the recent lows firmly on the table unless buyers can reclaim the moving average MA10 around $4,477.
Gold 1H Chart
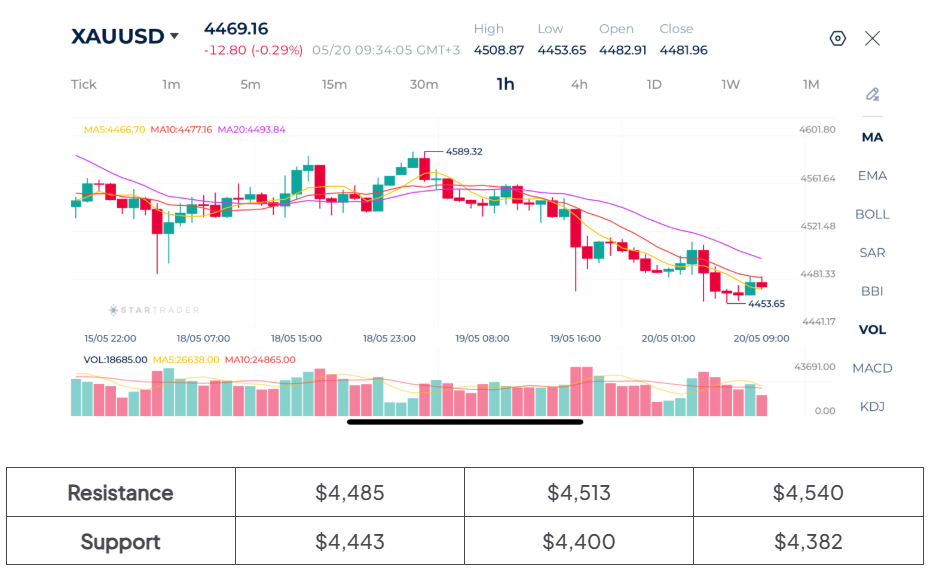
Source: STARTRADER app | Gold falls below $4,500 support level as selling continues
Brent Technical Analysis
Brent crude is currently caught in a sideways consolidation phase following a period of intense volatility. The price is hovering around $111.57, with the short and medium term moving averages flattening out right across the current price action. This compressing price structure follows aggressive historical swings, including a sharp dip to $108.66 and a rapid V-shaped recovery to $114.43.
Because this moving average squeeze indicates a contraction in volatility, price is likely to remain range-bound until a decisive breakout and hourly close occurs beyond the immediate $111.00 to $112.50 boundaries.
Brent 1H Chart
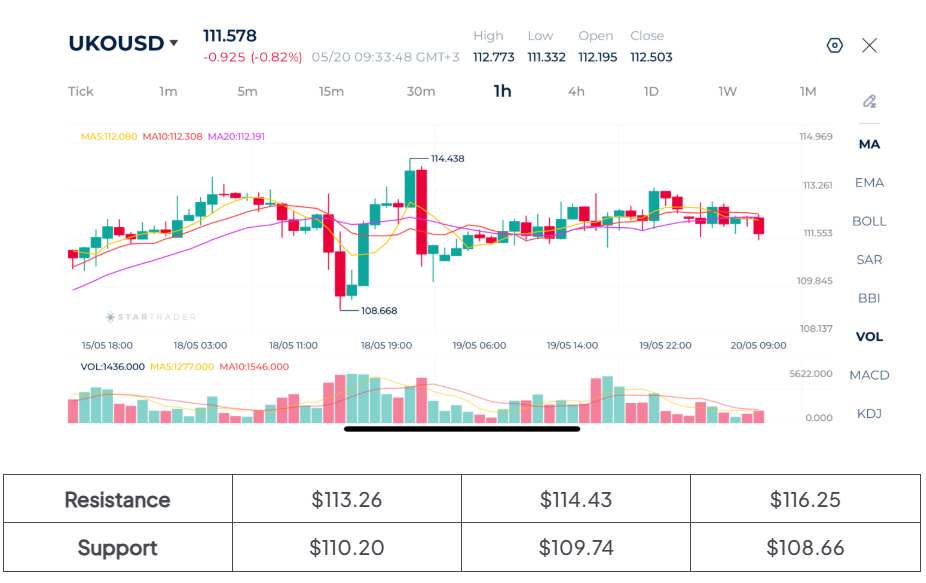
Source: STARTRADER app | Brent crude trades sideways following high volatility movements
S&P 500 Technical Analysis
The S&P500 index displays early signs of a potential short term bullish reversal, recovering slightly to $7,375 after a broader decline from its peak at $7,460. The index recently bottomed out at $7,342 and has since formed a sequence of higher lows, pushed along by consecutive green hourly candles.
Crucially, the price has managed to cross above both its MA5 and MA10 lines and is actively testing the MA20 at $7,370. If buyers can sustain this momentum and secure a close above this key moving average, it will confirm a structural shift toward the $7,400 resistance zone, whereas a failure here risks sending the index back to test its recent support level.
S&P 500 1H Chart
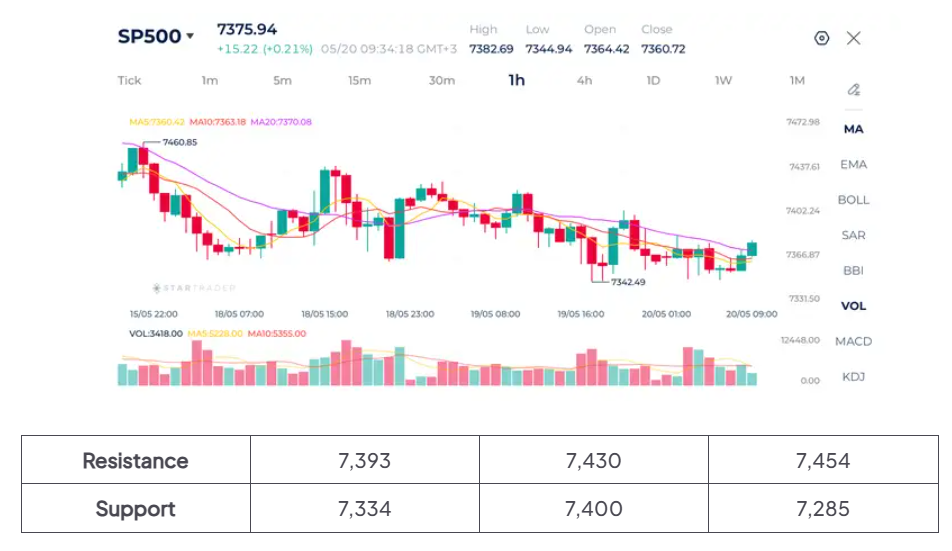
Source: STARTRADER app | US indices sell off for the third consecutive day
AUTHOR
Ghassan Albohtori
Financial Market Analyst - STARTRADER
Ghassan Albohtori is a financial market analyst with experience in macroeconomics, investing, and currency trading. He conducts in-depth market research covering fundamental and technical analysis of different instruments to find major changes in market trends. Mr. Ghassan's main focus is the effects of economic data on different asset classes and how this affects prices.
Risk Disclaimer: This material is provided for informational purposes only and does not constitute a recommendation or investment advice. Trading financial instruments on margin involves substantial risk and may not be appropriate for all investors.


Today Fundamental Analysis: Oil Breaks Above $102 as Middle East Tensions Continue to Escalate

Today Technical Analysis: Copper Approaches Record Highs on Surging Demand

Dollar struggles to gain ahead of US inflation data, yen extends rally

EBC Markets Briefing | Crude prices on solid footing amid deep supply concerns

The yen is strengthening before our very eyes

The Inflation Measure Keeping the Fed Cautious

US Yields Rise Despite Buybacks; Eyes on ECB Hike