 (1)-25620261315.jpg)





Today Technical Analysis: Gold Slides Further on US Dollar Strength, While Silver Remains Resilient


Gold Technical Analysis
Gold remains under significant bearish pressure on the 1-hour chart, trading around $4,428 after a sharp decline from the $4,670 area. After reaching a low of $4,396, gold has entered a sideways consolidation phase, but the recovery remains weak and has so far failed to reverse the broader bearish trend.
The moving averages MA(5), MA(10), and MA(20) continue to reinforce the negative outlook. Price is currently below all three averages, while the shorter-term average remains below the 10- and 20-period averages. This indicates that sellers still have the technical advantage.For now, the short-term bias remains bearish unless gold can reclaim the $4,455 area and establish itself above the moving averages. A break above $4,455 would provide the first indication that the recent sell-off is losing momentum and could allow a recovery toward $4,535. Conversely, continued rejection below $4,455 followed by a break under $4,396 would reinforce the bearish trend and could indicate a possibility of another leg lower.
Gold 1H Chart
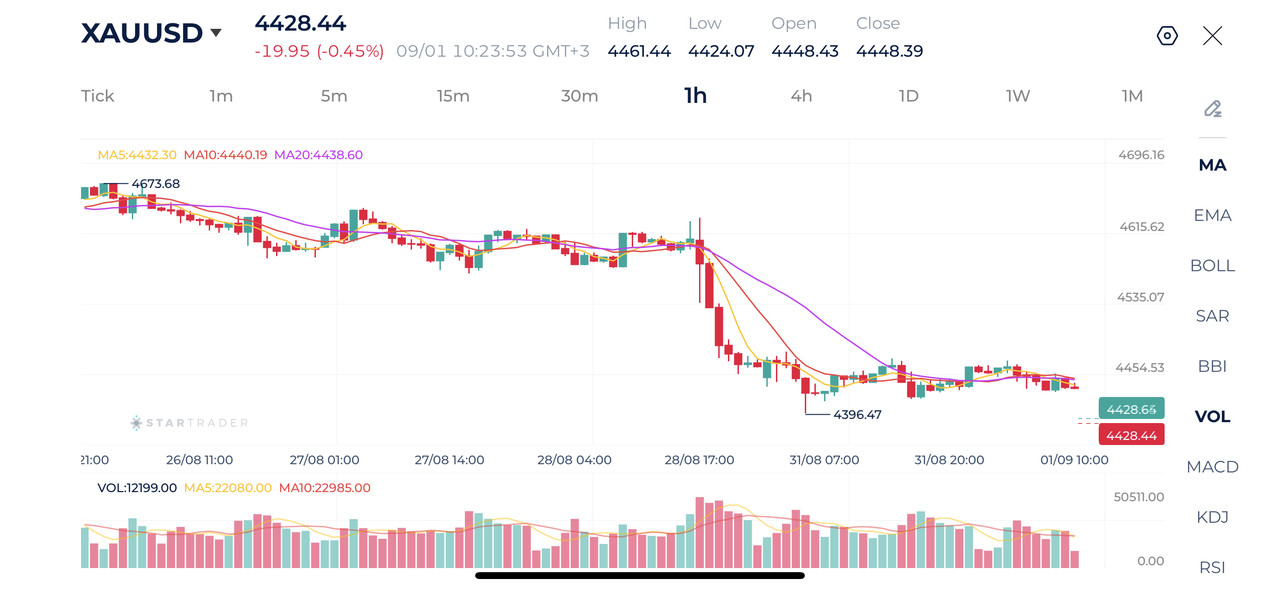
Source: STARTRADER app | Gold remains under pressure as the US dollar rises

Brent Technical Analysis
Brent crude is showing a clear bullish structure on the 1-hour chart. The latest move has pushed crude toward the $93.20 area, indicating that buyers remain firmly in control. The recent price action also shows that the market has successfully moved above the previous consolidation zone around $90–91.
The moving averages M(5), MA(10), and MA(20) confirm the bullish momentum. This alignment suggests that short-term momentum remains positive. Immediate resistance is located around $93.20–93.25, followed by the $93.75 area. On the downside, $92.70–92.50 is the first support zone, while $92.00 and the previous breakout area around $91.70 provide stronger support.
The outlook therefore remains bullish while Brent holds above the $92.00–92.50 region. A sustained break above $93.25 could extend the rally toward $93.75 and potentially the $94.40 area. However, after such a strong advance, a short-term pullback cannot be ruled out. A break below $92.00 would weaken the bullish structure and could trigger a deeper correction toward $91.70.
Brent 1H Chart
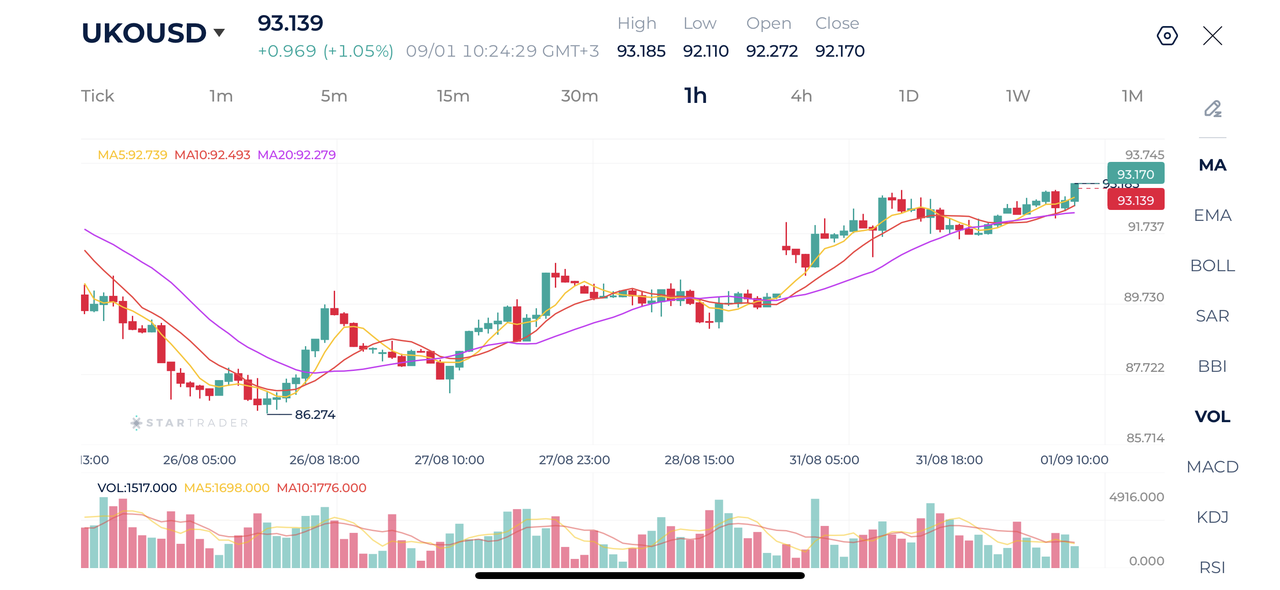
Source: STARTRADER app | Crude brent gains another 1% on continued US-Iran escalations

S&P 500 Technical Analysis
The S&P 500 is currently trading around 7,700 on the 1-hour chart. The index initially rallied strongly toward 7,777, but the subsequent rejection triggered a steep decline toward the 7,688 area. Since then, price has stabilized and started forming a modest recovery, suggesting that selling pressure has eased in the short term. However, the broader 1-hour structure remains relatively neutral because the index has not yet reclaimed the previous swing highs.
The moving averages MA(5), MA(10), and MA(20) are beginning to flatten. Price is currently trading just above the three averages. The immediate resistance is around 7,705–7,720, followed by 7,750 and the recent high at 7,777.20. On the downside, 7,688 represents the first important support, while a break below this area could expose 7,655.
Overall, the short-term bias is cautiously bullish as long as the index remains above 7,688 and the moving averages continue to hold. A sustained move above 7,720 would strengthen the recovery and potentially open the way toward 7,750 and 7,777.20. However, failure to break the 7,705–7,720 resistance zone could keep the index range-bound, while a decisive move below 7,688 would shift the short-term outlook back toward bearish.
S&P 500 1H Chart
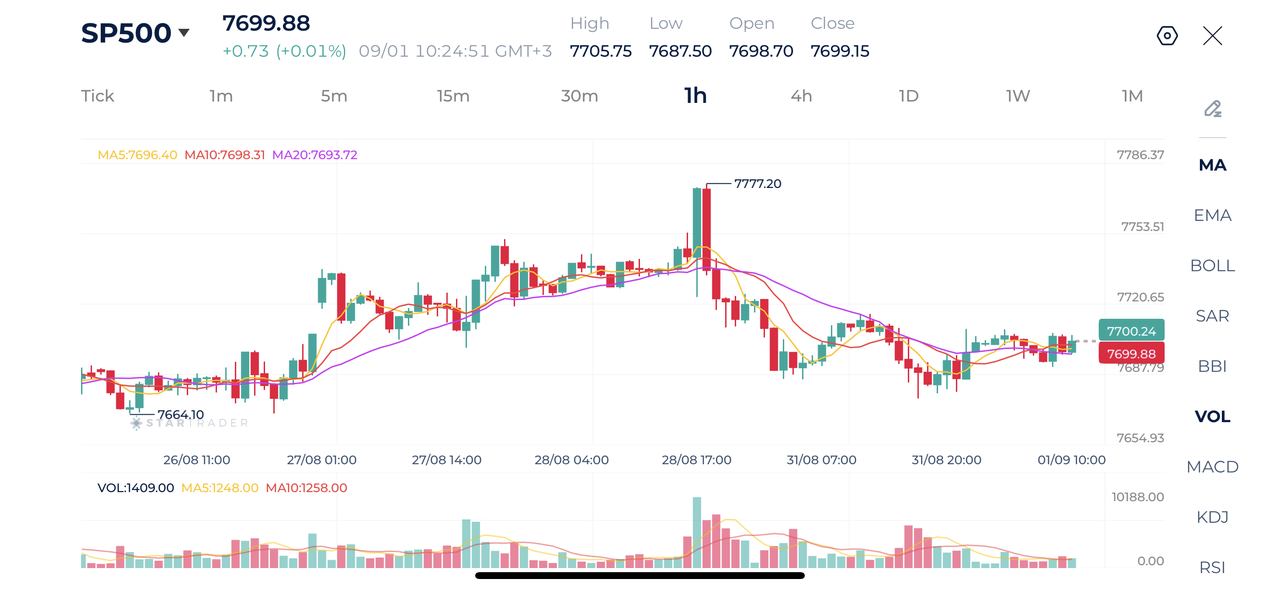
Source: STARTRADER app | S&P 500 remains bearish as the correction deepens

Risk Disclaimer: This material is provided for informational purposes only and does not constitute a recommendation or investment advice. Trading financial instruments on margin involves substantial risk and may not be appropriate for all investors.


EBC Markets Briefing | Aussie dollar propped up by US mid-term election uncertainty

Gold Edges Higher as Dollar Weakens Ahead of US Midterm Results

Gold/Silver & Gold/Platinum Ratios: Deconstructing the Metals Sell-Off Divergence

GBPUSD Edges Towards 1.3463 as Traders Brace for the Bank of England Decision

Weak NZ Jobs Data Keeps NZDUSD Under Pressure

Gold buying by central banks has hit its highest rate since 2024.

Daily Technical Analysis: Gold Reclaims $3,900 After Hitting Its Lowest Level Since October 2025