
 (1)-25620261315.jpg)





Today Technical Analysis: Gold Breaks $4,800 Barrier, Rallying Over 2% as Momentum Accelerates

Brent Technical Analysis
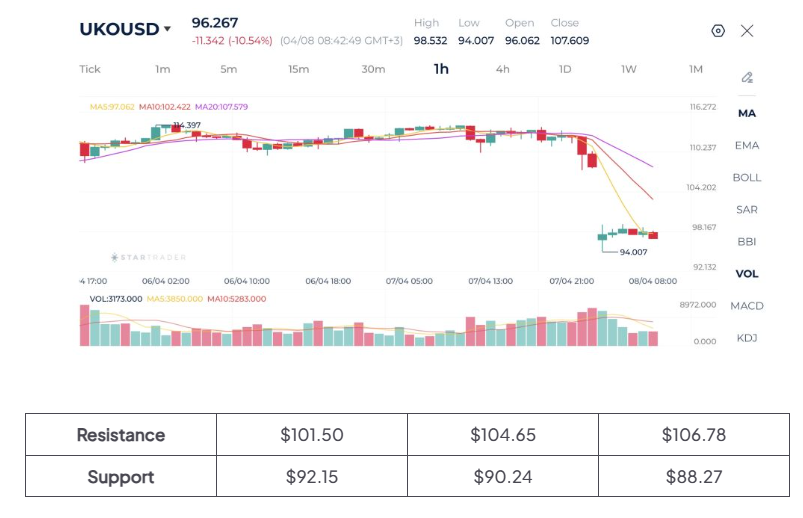
Oil is currently showing a sharp bearish breakdown that signals a potential trend reversal on the 1H timeframe. The market has experienced a strong impulsive sell-off, breaking below key support levels and all major moving averages, indicating a shift from bullish to bearish momentum.
The moving averages are now aligned bearishly, with price trading below MA5, MA10, and MA20, all sloping downward. This alignment confirms that sellers are in control, and any upward movement at this stage is likely corrective.
Volume analysis supports this view, as the sell-off was accompanied by increased volume, indicating strong participation from market players. The current price action shows a minor bounce from the $94.00 area, but this appears to be a weak corrective move.
As long as price remains below the $100–$102 resistance zone, the bearish outlook remains dominant, with potential continuation toward lower levels.
Brent 1H Chart
Dow Jones Technical Analysis
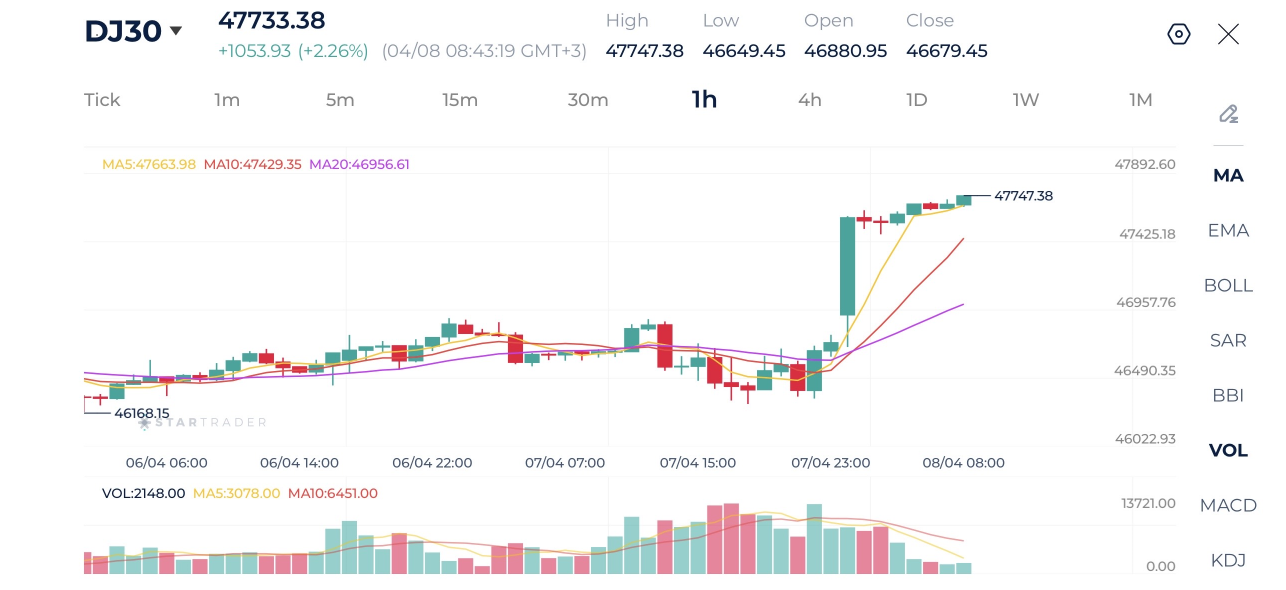
Dow Jones has delivered a decisive bullish breakout, confirming a shift from consolidation into impulsive expansion. This type of move reflects strong institutional participation, especially as the breakout occurred with a noticeable expansion in volatility.
From a moving average perspective, the structure is clearly bullish, with price trading above the 5, 10, and 20-period moving averages, all of which are now sloping upward. However, the current price is slightly extended from the short-term averages, which introduces the possibility of a temporary consolidation or minor pullback before continuation.
Volume behavior shows a spike during the breakout phase followed by declining volume during the consolidation at highs. This is typically a healthy sign, indicating that selling pressure is limited and the market is absorbing liquidity rather than reversing.
As long as price holds above the breakout zone around 47,400–47,500, the bullish structure remains intact, with potential continuation toward higher resistance levels near 47,850 and beyond. A break below this zone, however, could trigger a short-term corrective move toward the rising moving averages.
Dow Jones 1H Chart

Gold Technical Analysis
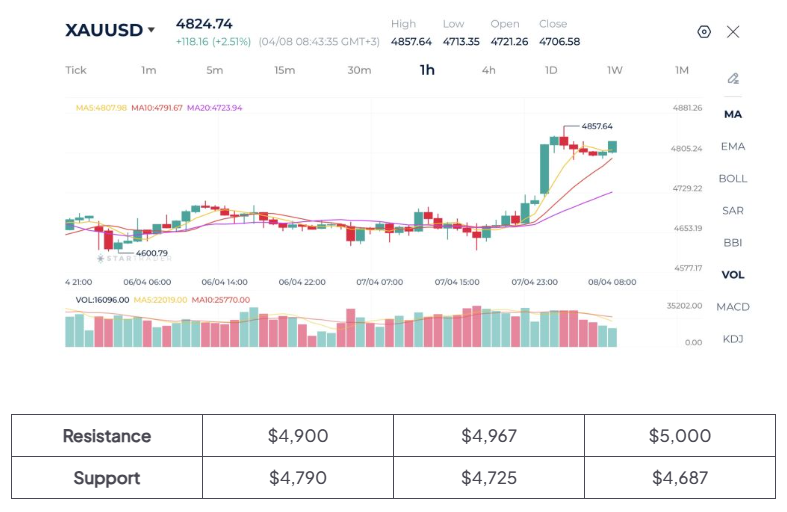
Gold shows a strong impulsive rally followed by a controlled consolidation phase, which is generally considered a continuation pattern.
Technically, price remains above all key moving averages, with the MA5 and MA10 acting as dynamic support and the MA20 trailing below as a broader trend support. The alignment of these moving averages confirms that the short term trend remains bullish.
Volume has decreased during the consolidation phase, which is typical and supports the idea that this is a pause for now.
As long as price holds above the $4,800–$4,790 support zone, the structure favors continuation toward a retest of $4,857 and potentially new highs above $4,880. However, a break below this support could shift momentum temporarily, leading to a deeper pullback toward the $4,720–$4,730 area.
Gold 1H Chart
AUTHOR
Ghassan Albohtori
Financial Market Analyst - STARTRADER
Ghassan Albohtori is a financial market analyst with experience in macroeconomics, investing, and currency trading. He conducts in-depth market research covering fundamental and technical analysis of different instruments to find major changes in market trends. Mr. Ghassan's main focus is the effects of economic data on different asset classes and how this affects prices.
Risk Disclaimer: This material is provided for informational purposes only and does not constitute a recommendation or investment advice. Trading financial instruments on margin involves substantial risk and may not be appropriate for all investors.


Today Fundamental Analysis: Oil Breaks Above $102 as Middle East Tensions Continue to Escalate

Today Technical Analysis: Copper Approaches Record Highs on Surging Demand

Dollar struggles to gain ahead of US inflation data, yen extends rally

EBC Markets Briefing | Crude prices on solid footing amid deep supply concerns

The yen is strengthening before our very eyes

The Inflation Measure Keeping the Fed Cautious

US Yields Rise Despite Buybacks; Eyes on ECB Hike